Velocity stands as one of the most critical metrics in Agile development, serving as the heartbeat of team performance measurement. This comprehensive guide explores how to effectively measure, track, and leverage velocity to optimize your team’s throughput and delivery predictability.
Understanding Velocity in Agile Context
Velocity represents the amount of work a development team completes during a single sprint, typically measured in story points, hours, or other estimation units. Unlike traditional productivity metrics that focus on individual output, velocity captures the collective capacity of the entire team to deliver working software.
The concept originated from the need to create predictable delivery schedules while maintaining the flexibility that Agile methodologies demand. By tracking velocity over multiple sprints, teams gain valuable insights into their sustainable pace and can make more accurate commitments for future work.
Key Components of Velocity Measurement
Effective velocity measurement relies on several fundamental components that work together to provide meaningful insights:
Story Points Completion: The primary metric involves summing up story points for all user stories marked as “Done” within a sprint. This includes only fully completed work that meets the Definition of Done criteria.
Consistent Team Composition: Velocity measurements remain most accurate when team membership stays relatively stable. Significant changes in team size or composition can dramatically impact velocity readings.
Sprint Duration Consistency: Maintaining consistent sprint lengths ensures comparable velocity measurements across different time periods. Most teams use 2-week sprints as the standard duration.
Calculating Team Velocity
The velocity calculation process involves straightforward mathematical operations, but the interpretation requires deeper understanding of team dynamics and project context.
Basic Velocity Formula
The fundamental velocity calculation follows this simple formula:
Sprint Velocity = Sum of Story Points for Completed User Stories
For example, if a team completes user stories worth 8, 5, 13, 3, and 2 story points in a single sprint, their velocity for that sprint equals 31 story points.
Average Velocity Calculation
Single sprint velocity provides limited insights due to natural variations in team performance. Average velocity offers more reliable planning data:
Average Velocity = Total Story Points Completed ÷ Number of Sprints
Most teams calculate average velocity using data from the last 3-6 sprints, balancing recent performance trends with statistical reliability. This rolling average helps smooth out anomalies while reflecting current team capabilities.
Velocity Tracking Methods
Teams employ various approaches to track and visualize velocity data effectively:
Velocity Charts: Bar charts displaying sprint-by-sprint velocity alongside the rolling average provide clear visual trends. These charts help identify patterns, improvements, or concerning drops in performance.
Burndown Integration: Combining velocity data with burndown charts creates comprehensive sprint monitoring. This integration shows not just final velocity but also the pace of work completion throughout the sprint.
Cumulative Flow Diagrams: These advanced visualizations show work flow through different stages, helping teams understand bottlenecks that might impact velocity.
Factors Affecting Team Velocity
Multiple variables influence team velocity, and understanding these factors enables better interpretation of velocity trends and more accurate future planning.
Team-Related Factors
Team Maturity: Newly formed teams typically show lower initial velocity that improves as members learn to work together effectively. Established teams demonstrate more consistent velocity patterns.
Skill Development: As team members develop new skills or gain domain expertise, velocity often increases. Training periods might temporarily reduce velocity before showing improvement.
Team Size Changes: Adding or removing team members significantly impacts velocity. New members require onboarding time, while departing members take institutional knowledge with them.
Process-Related Factors
Definition of Done Consistency: Teams with well-defined, consistently applied Done criteria show more predictable velocity. Changing these criteria mid-project can cause velocity fluctuations.
Story Estimation Accuracy: Improving estimation skills leads to more accurate velocity measurements. Teams often refine their estimation process over time, affecting velocity consistency.
Technical Debt Management: High technical debt can reduce velocity as teams spend more time maintaining existing code. Dedicated technical debt reduction efforts might temporarily lower feature velocity.
External Factors
Scope Changes: Mid-sprint scope changes can dramatically impact velocity measurements. Teams should track and account for these changes when analyzing velocity trends.
Dependencies and Blockers: External dependencies that cause delays directly affect velocity. Teams should identify and mitigate these factors to maintain consistent throughput.
Environmental Changes: Changes in development tools, infrastructure, or working conditions can temporarily impact velocity until teams adapt to new circumstances.
Using Velocity for Sprint Planning
Velocity data transforms sprint planning from guesswork into data-driven decision making, enabling teams to make realistic commitments while maintaining delivery quality.
Capacity Planning Approach
Effective sprint planning begins with understanding team capacity based on historical velocity data. Teams should consider their average velocity as the baseline but adjust for known factors affecting the upcoming sprint.
Standard Planning: Use average velocity from recent sprints as the starting point for sprint planning. This approach works well for stable teams with consistent conditions.
Adjusted Planning: Modify velocity targets based on known factors like team member availability, holidays, or planned technical debt work. This realistic approach prevents over-commitment.
Buffer Planning: Include a small buffer (typically 10-20% of average velocity) to account for unexpected issues or scope creep. This conservative approach improves delivery predictability.
Story Selection Strategy
With velocity-based capacity planning, teams can select user stories that align with their demonstrated throughput capabilities:
Priority-Based Selection: Start with highest-priority stories and continue selecting until reaching the velocity target. This ensures the most valuable work gets completed first.
Dependency Consideration: Factor in story dependencies when making selections. Sometimes lower-priority stories enable higher-priority work in future sprints.
Risk Assessment: Consider story complexity and uncertainty when approaching velocity limits. Leave room for stories that might require additional effort.
Velocity Tracking Tools and Techniques
Modern Agile teams have access to sophisticated tools that automate velocity tracking and provide actionable insights for continuous improvement.
Digital Tracking Solutions
Jira Software: Provides built-in velocity charts and reporting features that automatically calculate team velocity based on completed story points. The tool offers customizable dashboards and historical trend analysis.
Azure DevOps: Includes comprehensive velocity tracking with burndown charts and cumulative flow diagrams. The platform integrates velocity data with capacity planning tools.
Trello with Power-Ups: While basic, Trello can track velocity using story point Power-Ups and third-party reporting tools. This lightweight approach suits smaller teams.
Manual Tracking Methods
Some teams prefer manual tracking methods that provide more control over data collection and analysis:
Spreadsheet Tracking: Simple spreadsheets can effectively track velocity with customizable formulas and charts. This approach offers flexibility but requires manual data entry.
Physical Boards: Teams using physical Kanban or Scrum boards can track velocity using sticky notes and manual calculations. This tangible approach reinforces team awareness of velocity trends.
Hybrid Approaches: Many teams combine digital tools for data collection with manual analysis for deeper insights. This balanced approach leverages tool efficiency with human interpretation.
Common Velocity Measurement Pitfalls
Understanding common mistakes in velocity measurement helps teams avoid data misinterpretation and maintain focus on true performance improvement.
Measurement Misuse
Individual Performance Metrics: Using velocity to evaluate individual team members undermines collaboration and can lead to gaming behaviors. Velocity should always represent team performance.
Cross-Team Comparisons: Comparing velocity between different teams provides little value due to varying contexts, skill levels, and project complexities. Each team should focus on their own improvement trends.
Pressure for Velocity Increases: Constantly pushing teams to increase velocity can lead to corner-cutting, reduced quality, or estimation inflation. Sustainable velocity is more valuable than peak performance.
Data Interpretation Errors
Ignoring Context: Velocity changes often reflect external factors rather than team performance. Teams should always consider context when interpreting velocity trends.
Over-Reliance on Recent Data: Using only the most recent sprint for planning can lead to unrealistic commitments. Balanced historical data provides better planning foundation.
Scope Creep Ignorance: Failing to account for mid-sprint scope changes can skew velocity measurements and future planning accuracy.
Advanced Velocity Analysis Techniques
Sophisticated velocity analysis goes beyond basic tracking to provide deep insights into team performance patterns and improvement opportunities.
Trend Analysis
Moving Averages: Calculate rolling averages over different time periods to identify short-term fluctuations versus long-term trends. This analysis helps distinguish between temporary issues and fundamental changes.
Seasonal Patterns: Many teams experience velocity variations due to holidays, quarterly deadlines, or other cyclical factors. Identifying these patterns improves planning accuracy.
Correlation Analysis: Examine relationships between velocity and other metrics like defect rates, customer satisfaction, or team satisfaction. These correlations reveal the true cost of velocity optimization.
Predictive Modeling
Forecasting Techniques: Use statistical methods to predict future velocity based on historical trends. This approach helps with long-term planning and resource allocation.
Scenario Planning: Model different scenarios (team changes, scope adjustments, technical challenges) to understand their potential impact on velocity.
Confidence Intervals: Calculate confidence ranges for velocity predictions to better communicate uncertainty in planning estimates.
Velocity in Different Agile Frameworks
While velocity concepts remain consistent across Agile methodologies, implementation details vary based on the specific framework adopted by the team.
Scrum Implementation
In Scrum, velocity measurement integrates closely with sprint planning and retrospective ceremonies. Teams track velocity at the end of each sprint and use this data during the next sprint planning session.
Sprint Planning Integration: Velocity data directly informs how much work the team commits to in upcoming sprints. This integration creates a feedback loop that improves planning accuracy over time.
Retrospective Analysis: Sprint retrospectives should include velocity discussion, exploring factors that influenced the team’s throughput and identifying improvement opportunities.
Kanban Adaptation
Kanban teams adapt velocity concepts to their continuous flow approach, focusing on throughput measurement over fixed time periods.
Throughput Measurement: Instead of sprint-based velocity, Kanban teams measure stories completed per week or month. This approach maintains the throughput focus while accommodating continuous delivery.
Cycle Time Integration: Kanban velocity analysis often includes cycle time measurements to understand not just how much work is completed, but how quickly individual items flow through the system.
Improving Team Velocity
Sustainable velocity improvement requires a holistic approach that addresses technical, process, and team factors while maintaining work quality and team well-being.
Technical Improvements
Automation Investment: Investing in test automation, deployment automation, and development tooling can significantly improve team velocity by reducing manual overhead.
Technical Debt Management: Dedicated effort to reduce technical debt often leads to velocity improvements as teams spend less time fighting existing code complexity.
Skills Development: Targeted training and skill development can improve team velocity by reducing the time needed to complete complex tasks.
Process Optimization
Bottleneck Identification: Use velocity data alongside flow metrics to identify and address process bottlenecks that limit team throughput.
Definition of Done Refinement: Optimizing the Definition of Done to eliminate unnecessary work while maintaining quality can improve velocity without sacrificing value.
Estimation Accuracy: Improving story estimation accuracy leads to better velocity predictions and more realistic sprint planning.
Velocity Reporting and Communication
Effective velocity communication ensures stakeholders understand team performance while maintaining focus on value delivery rather than raw productivity metrics.
Stakeholder Reporting
Context-Rich Reports: Velocity reports should include context about factors affecting performance, not just raw numbers. This approach helps stakeholders understand performance variations.
Trend Focus: Emphasize velocity trends over individual sprint performance. This perspective promotes understanding of team improvement journeys rather than sprint-to-sprint fluctuations.
Value Correlation: Connect velocity data with business value delivery metrics to demonstrate the relationship between team throughput and organizational outcomes.
Team Communication
Transparency Principles: Share velocity data openly within the team to promote collective ownership of performance improvement.
Learning Orientation: Frame velocity discussions around learning and improvement rather than performance evaluation. This approach encourages honest reflection and continuous improvement.
Goal Alignment: Ensure velocity improvement efforts align with broader team and organizational goals to maintain focus on meaningful outcomes.
Future of Velocity Measurement
As Agile practices evolve and technology advances, velocity measurement continues to adapt to new development approaches and organizational needs.
Integration with DevOps
Modern velocity measurement increasingly integrates with DevOps metrics to provide comprehensive views of development and delivery performance. This integration helps teams understand the full pipeline from development to production deployment.
AI-Enhanced Analytics
Artificial intelligence and machine learning tools are beginning to enhance velocity analysis by identifying patterns, predicting future performance, and suggesting improvement strategies based on historical data and industry benchmarks.
Velocity measurement remains a cornerstone of effective Agile team management, providing the data foundation for realistic planning, continuous improvement, and stakeholder communication. By understanding the principles, techniques, and pitfalls outlined in this guide, teams can leverage velocity data to optimize their throughput while maintaining sustainable development practices and high-quality deliverables.
Remember that velocity serves as a tool for team improvement, not a weapon for performance evaluation. When used correctly, velocity measurement empowers teams to make data-driven decisions, set realistic expectations, and continuously improve their delivery capabilities in service of greater business value creation.
Related Posts
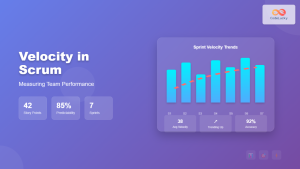
Velocity in Scrum: The Complete Guide to Measuring and Improving Team Performance
Velocity is one of the most crucial metrics in Scrum that helps teams measure their performance and plan future sprints...
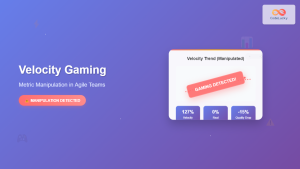
Velocity Gaming: Metric Manipulation and How to Prevent It in Agile Teams
Velocity gaming represents one of the most insidious threats to Agile team performance and organizational trust. When teams manipulate their...
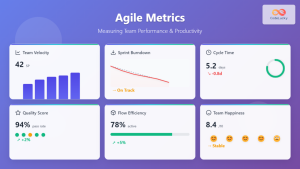
Agile Metrics: Complete Guide to Measuring Team Performance and Productivity
Measuring team performance in agile environments requires a strategic approach that goes beyond traditional project management metrics. Agile metrics provide...
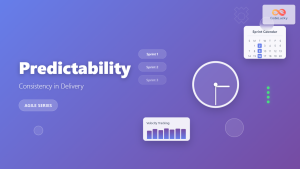
Predictability: Consistency in Delivery Through Agile Methodologies
Predictability in Agile development represents the cornerstone of successful project delivery, enabling teams to establish consistent patterns that stakeholders can...
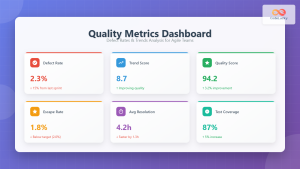
Quality Metrics: Defect Rates and Trends – Complete Guide for Agile Teams
Understanding Quality Metrics in Agile Development Quality metrics serve as the compass for Agile teams navigating the complex landscape of...
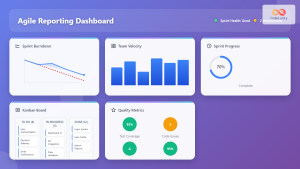
Agile Reporting: Complete Guide to Real-Time Dashboards and Performance Insights
Agile reporting transforms raw project data into actionable insights that drive successful software delivery. Unlike traditional waterfall reporting that focuses...

Story Points: Complete Guide to Agile Estimation for Development Teams
Story points represent one of the most powerful yet misunderstood concepts in Agile software development. Unlike traditional time-based estimates, story...
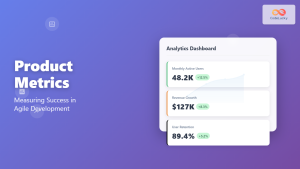
Product Metrics: Key Performance Indicators for Measuring Agile Product Success
Understanding Product Metrics in Agile Development Product metrics serve as the compass that guides Agile teams toward delivering genuine value...
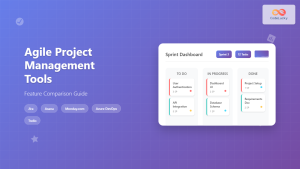
Agile Project Management Tools: Complete Feature Comparison Guide 2025
Selecting the right Agile project management tool can make or break your team's productivity and project success. With dozens of...
Performance Management: Agile Approach to Modern Reviews and Continuous Feedback
Understanding Agile Performance Management Traditional performance reviews often fail to capture the dynamic nature of modern software development teams. Agile...
Agile Team Dynamics: Building High-Performance Teams That Deliver Results
Agile team dynamics form the backbone of successful software development projects, determining whether teams thrive or struggle in today's fast-paced...
Outcome-Based Agile: Focus on Results That Drive Business Value
Traditional Agile methodologies often fall into the trap of measuring success by output metrics like story points completed, features delivered,...
- Understanding Velocity in Agile Context
- Calculating Team Velocity
- Factors Affecting Team Velocity
- Using Velocity for Sprint Planning
- Velocity Tracking Tools and Techniques
- Common Velocity Measurement Pitfalls
- Advanced Velocity Analysis Techniques
- Velocity in Different Agile Frameworks
- Improving Team Velocity
- Velocity Reporting and Communication
- Future of Velocity Measurement