Understanding Quality Metrics in Agile Development
Quality metrics serve as the compass for Agile teams navigating the complex landscape of software development. Among these metrics, defect rates and trends stand out as critical indicators that reveal the health of your development process, the effectiveness of your testing strategies, and the overall quality of your deliverables.
In today’s fast-paced development environment, understanding and leveraging quality metrics isn’t just about identifying problems—it’s about creating a culture of continuous improvement that drives exceptional software delivery. This comprehensive guide explores how to implement, measure, and optimize defect-related quality metrics to transform your Agile team’s performance.
The Foundation of Quality Metrics
Quality metrics in Agile development represent quantifiable measures that help teams assess the effectiveness of their processes and the quality of their output. Unlike traditional waterfall approaches where quality is often measured at the end of development cycles, Agile teams require real-time insights to make informed decisions throughout iterative development phases.
Defect rates and trends form the backbone of quality measurement because they provide objective, measurable data points that directly correlate with user experience and product reliability. These metrics enable teams to identify patterns, predict potential issues, and implement proactive measures to maintain high-quality standards.
Key Components of Quality Metrics
Effective quality metrics encompass several interconnected elements that work together to provide comprehensive insights into your development process. Defect density measures the number of defects per unit of code, typically expressed as defects per thousand lines of code or defects per story point. This metric helps teams understand the relative quality of different components or releases.
Defect discovery rate tracks how quickly defects are identified throughout the development lifecycle. Teams that discover defects early in the process typically have more mature testing practices and better quality control mechanisms in place.
Defect resolution time measures the average time between defect identification and resolution. This metric provides insights into team efficiency and helps identify bottlenecks in the debugging and fixing process.
Essential Defect Rate Metrics for Agile Teams
Implementing the right defect rate metrics requires understanding which measurements provide the most actionable insights for your specific context. Different metrics serve different purposes, and successful Agile teams typically employ a combination of complementary measurements.
Defect Escape Rate
The defect escape rate measures the percentage of defects that make it to production without being caught during development or testing phases. This critical metric indicates the effectiveness of your quality assurance processes and testing coverage.
Calculate defect escape rate using the formula: (Number of production defects / Total defects found) × 100. A high escape rate suggests gaps in your testing strategy or insufficient test coverage, while a consistently low escape rate indicates robust quality control processes.
Leading Agile teams maintain defect escape rates below 5%, with high-performing teams often achieving rates below 2%. However, the acceptable threshold varies depending on your industry, application criticality, and user expectations.
Defect Injection Rate
Defect injection rate measures how many defects are introduced during specific development phases or activities. This metric helps teams identify which development practices or phases contribute most significantly to overall defect counts.
Track defect injection by categorizing defects based on their likely introduction point—requirements analysis, design, coding, or integration. This granular approach enables targeted process improvements and helps teams focus their quality efforts where they’ll have the greatest impact.
Critical vs. Non-Critical Defect Ratios
Not all defects carry equal weight in terms of user impact or business consequences. Tracking the ratio of critical to non-critical defects provides insights into the severity of quality issues and helps prioritize improvement efforts.
Establish clear severity classifications that align with your business context. Critical defects might include security vulnerabilities, data corruption issues, or functionality that prevents core user workflows. Non-critical defects could encompass minor UI inconsistencies or edge-case scenarios with limited user impact.
Analyzing Defect Trends for Continuous Improvement
Raw defect numbers tell only part of the story. Trend analysis transforms these numbers into actionable insights that drive meaningful improvements in your development process. Effective trend analysis requires consistent data collection, appropriate visualization, and regular interpretation of patterns.
Temporal Trend Analysis
Examine defect patterns across different time dimensions to identify cyclical issues or improvement trends. Sprint-over-sprint analysis reveals short-term patterns and helps teams assess the immediate impact of process changes or new practices.
Release-over-release trending provides longer-term perspectives on quality evolution and helps validate the effectiveness of major process improvements or tool implementations. This analysis is particularly valuable for demonstrating quality improvements to stakeholders and justifying investment in quality initiatives.
Seasonal or cyclical analysis can reveal patterns related to team changes, external factors, or business cycles that impact quality. For example, teams might notice quality dips during holiday seasons when key team members are unavailable, or improvements following major training initiatives.
Defect Category Trending
Categorize defects by type, source, or impact to identify systematic issues that require targeted interventions. Common categories include functional defects, performance issues, security vulnerabilities, usability problems, and integration failures.
Track how different defect categories trend over time to understand whether your improvement efforts are addressing the right areas. A team might discover that while overall defect counts are decreasing, security-related defects are increasing, indicating a need for enhanced security testing practices.
Predictive Trend Analysis
Advanced teams use historical defect data to predict future quality challenges and proactively address potential issues. Statistical analysis of defect trends can help forecast quality risks for upcoming releases and inform resource allocation decisions.
Implement moving averages, regression analysis, and correlation studies to identify leading indicators of quality issues. For example, you might discover that increases in code churn or developer workload correlate with higher defect rates in subsequent sprints.
Implementing Effective Measurement Systems
Successful quality metrics implementation requires more than just collecting data—it demands thoughtful system design, appropriate tooling, and cultural alignment around quality objectives. Teams must balance measurement overhead with actionable insights to ensure metrics drive positive behaviors rather than bureaucratic burden.
Tool Integration and Automation
Modern development environments offer numerous opportunities for automated quality metric collection. Integrate your issue tracking systems, continuous integration pipelines, and testing frameworks to automatically capture defect-related data without manual intervention.
Popular tools like Jira, Azure DevOps, and GitHub Issues can be configured to automatically categorize and track defects based on labels, components, or custom fields. Continuous integration systems can automatically report test results and link them to defect trends, providing real-time quality insights.
Dashboard automation ensures that quality metrics remain visible and accessible to all team members. Tools like Grafana, Tableau, or custom solutions can pull data from multiple sources to create comprehensive quality dashboards that update automatically as new data becomes available.
Data Quality and Consistency
The value of quality metrics depends entirely on the accuracy and consistency of underlying data. Establish clear guidelines for defect classification, severity assignment, and lifecycle management to ensure data reliability across team members and time periods.
Create standardized defect templates that capture essential information consistently. Include fields for defect category, severity, discovery phase, resolution time, and root cause analysis. Regular data quality audits help identify and correct inconsistencies that could skew metric calculations.
Train team members on proper defect reporting and classification procedures. Consistent data entry practices are crucial for meaningful trend analysis and accurate metric calculations.
Advanced Analytics and Reporting Strategies
Basic defect counting provides limited insights compared to sophisticated analytical approaches that reveal deeper patterns and relationships within your quality data. Advanced analytics enable teams to move beyond reactive defect management toward predictive quality assurance.
Statistical Process Control
Apply statistical process control principles to defect rate monitoring by establishing control limits and identifying when quality processes are operating outside normal parameters. Control charts help distinguish between normal variation and significant quality issues that require intervention.
Calculate upper and lower control limits based on historical defect rate data, then monitor current rates against these boundaries. Points outside control limits indicate special causes that warrant investigation, while points within limits represent normal process variation.
Correlation Analysis
Examine relationships between defect rates and other development metrics to identify contributing factors and improvement opportunities. Strong correlations might exist between defect rates and factors like code complexity, team velocity, or testing coverage.
Use correlation analysis to validate hypotheses about quality drivers and guide improvement initiatives. For example, if analysis reveals a strong correlation between code review coverage and defect rates, teams can prioritize improving their review processes.
Cohort Analysis
Group defects by common characteristics—such as development sprint, team member, or feature area—to identify patterns that might be obscured in aggregate analysis. Cohort analysis can reveal quality differences between team members, components, or time periods.
This approach is particularly valuable for identifying the long-term quality impact of process changes or training initiatives. Track defect rates for features developed before and after implementing new practices to measure improvement effectiveness.
Creating Actionable Quality Dashboards
Effective quality dashboards transform raw metrics into visual insights that enable quick decision-making and maintain team focus on quality objectives. Well-designed dashboards balance comprehensive information with clarity and usability.
Dashboard Design Principles
Structure dashboards around key quality questions that your team regularly addresses. Primary displays should answer fundamental questions like “How is our current quality compared to targets?” and “What quality trends are emerging?”
Use visual hierarchy to guide attention toward the most critical information. Place key performance indicators prominently, use color coding to highlight exceptions or concerns, and provide drill-down capabilities for detailed analysis.
Design dashboards for your specific audience—executive summaries require different information and presentation than detailed technical analysis dashboards used by development teams.
Real-Time vs. Historical Views
Balance real-time monitoring with historical trend analysis by providing both current status indicators and longer-term trend visualizations. Real-time views help teams respond quickly to emerging quality issues, while historical trends inform strategic improvement decisions.
Implement alerting mechanisms that notify teams when quality metrics exceed acceptable thresholds. Automated alerts enable proactive responses to quality degradation before issues impact users or become more expensive to resolve.
Team Adoption and Cultural Integration
Technical implementation of quality metrics represents only half the challenge—successful adoption requires cultural changes that embrace data-driven quality improvement. Teams must view metrics as tools for empowerment rather than instruments of judgment.
Building Quality-Focused Culture
Position quality metrics as collaborative tools that help the entire team improve rather than individual performance measures. Emphasize learning and improvement over blame assignment when discussing quality issues revealed by metrics.
Regularly discuss quality metrics in sprint retrospectives and planning sessions. Use trend data to celebrate improvements and identify areas for focused attention in upcoming iterations.
Encourage experimentation with quality improvement initiatives and use metrics to evaluate their effectiveness. This approach transforms quality improvement from guesswork into evidence-based decision making.
Training and Skill Development
Invest in team training on statistical analysis, data interpretation, and quality improvement techniques. Team members who understand the theory behind quality metrics are more likely to use them effectively and contribute meaningful insights.
Provide regular training on proper defect classification and data entry procedures to maintain data quality. Consider creating internal documentation or guidelines that standardize quality measurement practices across your organization.
Common Pitfalls and Best Practices
Learning from common mistakes accelerates your team’s journey toward effective quality metrics implementation. Understanding typical pitfalls helps teams avoid measurement problems that undermine quality improvement efforts.
Avoiding Measurement Pitfalls
Gaming the metrics occurs when team members modify their behavior to improve metric scores without actually improving quality. Prevent gaming by using multiple complementary metrics and focusing on outcomes rather than individual numbers.
Analysis paralysis happens when teams collect extensive data but fail to translate insights into action. Establish regular review cycles and decision-making processes that ensure metrics drive concrete improvements.
Metric overload overwhelms teams with too many measurements, diluting focus and reducing effectiveness. Start with a core set of essential metrics and gradually expand based on experience and specific improvement needs.
Establishing Best Practices
Focus on trends rather than absolute numbers when evaluating quality performance. Short-term fluctuations are normal, but consistent trends indicate systematic issues or improvements that warrant attention.
Combine quantitative metrics with qualitative insights from team members, user feedback, and stakeholder observations. Numbers tell part of the story, but human insights provide context and meaning that pure data cannot capture.
Regularly review and evolve your quality metrics based on changing business needs, team maturity, and lessons learned from implementation experience. Metrics that served you well initially might become less relevant as your team and processes mature.
Integration with Agile Practices
Quality metrics achieve maximum value when integrated seamlessly with existing Agile practices rather than implemented as separate, parallel processes. Successful integration requires aligning measurement activities with sprint cycles, story acceptance criteria, and continuous improvement practices.
Sprint-Level Integration
Incorporate quality metric reviews into sprint planning, daily standups, and retrospectives to maintain constant focus on quality objectives. Use defect trend data to inform story point estimation and sprint capacity planning.
During sprint planning, review quality metrics from previous sprints to identify patterns that might affect upcoming work. High defect rates in specific components might warrant additional testing time or architectural review.
Include quality metric discussions in daily standups when trends indicate emerging issues. Early identification of quality degradation enables teams to adjust their approach before problems compound.
Definition of Done Integration
Incorporate quality standards into your Definition of Done to ensure consistent quality expectations across all team members. Specify acceptable defect thresholds, testing coverage requirements, and quality gate criteria that must be met before considering work complete.
Use historical quality data to establish realistic but challenging quality standards. Teams should strive for continuous improvement while maintaining achievable expectations that don’t become demotivating.
Scaling Quality Metrics Across Organizations
Organizations with multiple Agile teams face additional challenges in implementing consistent quality measurement practices while respecting team autonomy and context-specific needs. Successful scaling requires balancing standardization with flexibility.
Standardization vs. Customization
Establish core quality metrics that all teams track to enable organization-wide quality visibility and benchmarking. These might include defect escape rate, critical defect counts, and resolution time averages.
Allow teams to supplement core metrics with context-specific measurements that address their unique quality challenges. A team working on user-facing applications might track usability defects, while a team developing APIs might focus on performance and reliability metrics.
Cross-Team Learning
Create forums for teams to share quality insights, improvement strategies, and lessons learned from their metrics implementation. Regular quality communities of practice help disseminate best practices and prevent teams from solving similar problems in isolation.
Implement organization-wide quality dashboards that highlight successful improvement initiatives and identify teams that might benefit from additional support or resources.
Future Trends in Quality Metrics
The landscape of quality metrics continues evolving with advances in artificial intelligence, machine learning, and automated testing technologies. Understanding emerging trends helps teams prepare for future opportunities and challenges in quality measurement.
AI-Powered Quality Analytics
Machine learning algorithms increasingly enable predictive quality analytics that identify potential defect hotspots before they manifest. These systems analyze code changes, developer behavior patterns, and historical defect data to provide early warning systems for quality risks.
Natural language processing technologies can automatically categorize and prioritize defects based on user feedback, support tickets, and error reports, reducing manual classification overhead while improving consistency.
Continuous Quality Measurement
Real-time quality measurement systems provide instant feedback on code changes, test results, and user behavior, enabling teams to respond immediately to quality degradation. These systems integrate quality metrics directly into development workflows rather than requiring separate measurement activities.
Automated quality gates in deployment pipelines use real-time metrics to make deployment decisions, preventing low-quality code from reaching production environments without human intervention.
Measuring Return on Investment
Demonstrating the business value of quality metrics initiatives helps secure ongoing support and resources for quality improvement efforts. Effective ROI measurement connects quality improvements to tangible business outcomes.
Cost-Benefit Analysis
Calculate the cost of implementing quality metrics systems including tool licensing, training time, and ongoing maintenance overhead. Compare these costs against benefits such as reduced support costs, decreased rework time, and improved customer satisfaction.
Track metrics like defect fix cost by discovery phase to quantify the value of early defect detection. Defects found during development typically cost 10-100 times less to fix than those discovered in production.
Business Impact Measurement
Connect quality improvements to business metrics such as customer satisfaction scores, support ticket volumes, and user retention rates. These connections help stakeholders understand how quality investments translate into business value.
Monitor revenue impact of quality improvements by tracking metrics like reduced customer churn, increased user engagement, and decreased support costs. Quality improvements often generate substantial business value that justifies continued investment in measurement and improvement initiatives.
Conclusion: Building Excellence Through Measurement
Quality metrics and defect trend analysis represent powerful tools for Agile teams committed to delivering exceptional software. Success requires more than technical implementation—it demands cultural commitment to continuous improvement, thoughtful integration with existing practices, and persistent focus on translating insights into action.
Teams that master quality metrics gain competitive advantages through faster delivery of higher-quality software, reduced technical debt, and improved stakeholder confidence. The investment in measurement systems pays dividends through reduced rework, decreased support costs, and enhanced team productivity.
Start with fundamental metrics like defect rates and escape rates, then gradually expand your measurement sophistication as your team develops expertise and identifies specific improvement opportunities. Remember that the goal of quality metrics isn’t perfect measurement—it’s actionable insights that drive meaningful improvements in your software development process.
By implementing the strategies and practices outlined in this guide, your Agile team can transform quality metrics from simple reporting tools into strategic assets that enable sustained excellence in software delivery. The journey toward quality-driven development begins with the first metric you implement and evolves through consistent application of data-driven improvement practices.
Related Posts
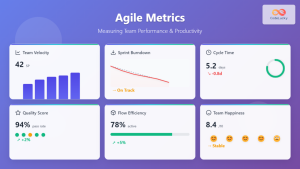
Agile Metrics: Complete Guide to Measuring Team Performance and Productivity
Measuring team performance in agile environments requires a strategic approach that goes beyond traditional project management metrics. Agile metrics provide...
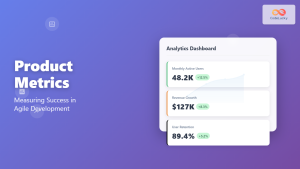
Product Metrics: Key Performance Indicators for Measuring Agile Product Success
Understanding Product Metrics in Agile Development Product metrics serve as the compass that guides Agile teams toward delivering genuine value...
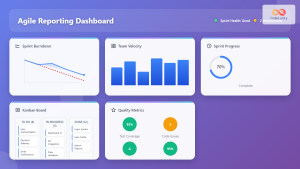
Agile Reporting: Complete Guide to Real-Time Dashboards and Performance Insights
Agile reporting transforms raw project data into actionable insights that drive successful software delivery. Unlike traditional waterfall reporting that focuses...
Performance Management: Agile Approach to Modern Reviews and Continuous Feedback
Understanding Agile Performance Management Traditional performance reviews often fail to capture the dynamic nature of modern software development teams. Agile...

DevOps Metrics and Optimization: Measuring Success and Driving Continuous Improvement
Welcome to the next installment in our "DevOps from Scratch" series! In our previous posts, we've explored the fundamentals of...

Continuous Testing: Quality at Speed in Modern Agile Development
Understanding Continuous Testing in the Agile Era Continuous testing has emerged as a cornerstone of modern Agile development, fundamentally transforming...

Agile 2.0: Next Generation Agile Thinking for Modern Software Development
Understanding Agile 2.0: The Evolution Beyond Traditional Agile Agile 2.0 represents a significant evolution in project management and software development...

Velocity: Team Throughput Measurement in Agile Development
Velocity stands as one of the most critical metrics in Agile development, serving as the heartbeat of team performance measurement....

Outcome-Based Agile: Focus on Results That Drive Business Value
Traditional Agile methodologies often fall into the trap of measuring success by output metrics like story points completed, features delivered,...
DevOps and Agile: Extending Agility to Operations – Complete Guide for Modern Software Delivery
The evolution of software development has witnessed remarkable transformations, from traditional waterfall methodologies to Agile practices, and now to the...

Definition of Done: Essential Quality Standards and Best Practices in Scrum
What is the Definition of Done in Scrum? The Definition of Done (DoD) is a crucial Scrum artifact that establishes...
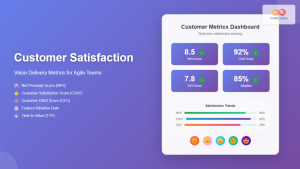
Customer Satisfaction: Value Delivery Metrics for Agile Teams
In today's competitive software landscape, customer satisfaction serves as the ultimate measure of Agile team success. While traditional metrics focus...