Agile reporting transforms raw project data into actionable insights that drive successful software delivery. Unlike traditional waterfall reporting that focuses on documentation and milestones, Agile reporting emphasizes real-time visibility, continuous improvement, and stakeholder collaboration through interactive dashboards and meaningful metrics.
What is Agile Reporting?
Agile reporting is a lightweight, visual approach to tracking project progress and team performance in Agile environments. It focuses on delivering timely, relevant information that helps teams make informed decisions quickly. The core principle centers on transparency and collaboration, ensuring all stakeholders have access to current project status without overwhelming them with unnecessary details.
Traditional reporting methods often create bottlenecks with lengthy status meetings and static documents. Agile reporting eliminates these inefficiencies by providing automated, real-time updates through intuitive dashboards that highlight what matters most: team velocity, sprint progress, quality metrics, and impediment resolution.
Key Components of Agile Dashboards
Sprint Progress Tracking
Effective Agile dashboards prominently display current sprint status with visual indicators showing completed, in-progress, and remaining work. Burndown charts provide instant insight into whether the team is on track to meet sprint commitments, while burnup charts reveal scope changes and progress toward release goals.
Sprint health indicators use color-coded status markers to quickly communicate overall sprint condition. Green indicates healthy progress, yellow suggests minor concerns requiring attention, and red signals significant risks needing immediate intervention. These visual cues enable rapid decision-making without diving into detailed reports.
Team Velocity Metrics
Velocity tracking shows team delivery capacity over multiple sprints, helping with realistic planning and continuous improvement. Historical velocity data enables more accurate sprint planning and identifies trends in team performance. The dashboard should display both story points completed and the number of user stories delivered to provide comprehensive velocity insights.
Velocity forecasting uses historical data to predict future delivery timelines and helps stakeholders understand realistic expectations for upcoming releases. This predictive capability is crucial for managing stakeholder expectations and making informed decisions about scope and timeline adjustments.
Quality and Technical Metrics
Code quality indicators track technical debt, test coverage, and defect trends to ensure sustainable development practices. These metrics prevent technical shortcuts from accumulating and compromising long-term project success. Automated testing results, code review completion rates, and continuous integration build status provide immediate feedback on code quality.
Defect tracking within sprints shows bug discovery and resolution rates, helping teams maintain quality standards while delivering features. The dashboard should highlight critical bugs requiring immediate attention and track the overall defect trend to identify quality improvements or degradation over time.
Essential Agile Reporting Metrics
Delivery Performance Indicators
Lead time measures the duration from requirement identification to feature delivery, providing insight into overall process efficiency. Cycle time tracks the time from development start to completion, helping identify bottlenecks in the development workflow. These metrics enable teams to optimize their processes and improve delivery predictability.
Cumulative flow diagrams visualize work distribution across different workflow stages, revealing bottlenecks and inefficiencies in the development process. These diagrams help teams balance work-in-progress limits and maintain steady delivery flow throughout sprints.
Team Health and Engagement Metrics
Team happiness surveys and retrospective action items provide qualitative insights into team morale and continuous improvement efforts. Happy teams perform better and deliver higher quality work, making team health a critical success indicator for Agile projects.
Impediment tracking shows obstacles preventing team progress and measures resolution times. Effective impediment management keeps teams productive and demonstrates leadership commitment to removing barriers to success.
Business Value Metrics
Customer satisfaction scores and feature adoption rates measure the business impact of delivered features. These metrics ensure development efforts align with customer needs and business objectives, providing justification for continued investment in Agile practices.
Return on investment calculations for delivered features help prioritize future development work and demonstrate the business value of Agile delivery. This financial perspective strengthens stakeholder support and guides strategic decision-making.
Creating Effective Agile Dashboards
Design Principles for Maximum Impact
Successful Agile dashboards follow the “information radiator” principle, displaying critical information prominently where everyone can see it easily. Visual hierarchy guides viewers to the most important information first, using size, color, and positioning to emphasize key metrics and alerts.
Minimize cognitive load by presenting information clearly and avoiding cluttered displays. Each dashboard element should serve a specific purpose and contribute to informed decision-making. Remove any metrics that don’t drive action or provide valuable insights to maintain focus on what matters most.
Real-Time Data Integration
Automated data collection eliminates manual reporting overhead and ensures dashboard accuracy. Integration with development tools like Jira, Azure DevOps, or GitHub provides seamless data flow from work tracking systems to reporting dashboards. This automation reduces reporting errors and frees team members to focus on development work.
API connections enable custom dashboard solutions that pull data from multiple sources, creating comprehensive views of project health. Real-time updates ensure stakeholders always see current information without delays from manual reporting cycles.
Customization for Different Audiences
Executive dashboards focus on high-level metrics like delivery dates, budget status, and business value delivered. These stakeholders need strategic insights rather than detailed operational information. Summary views with trend indicators help executives understand project trajectory and make resource allocation decisions.
Team-level dashboards provide detailed operational metrics that help with day-to-day work management. Sprint burndown charts, task completion status, and impediment lists give teams the information needed to self-organize and adapt to changing conditions.
Popular Agile Reporting Tools
Integrated Platform Solutions
Jira offers comprehensive Agile reporting with built-in dashboards, burndown charts, and velocity tracking. Its native integration with development workflows provides seamless data collection and reporting automation. Custom dashboard configurations support different team structures and reporting needs.
Azure DevOps provides powerful analytics and reporting capabilities with customizable dashboards and query-based reporting. Its integration with Microsoft’s development ecosystem makes it particularly attractive for organizations already using Microsoft technologies.
Specialized Dashboard Tools
Tableau and Power BI offer advanced data visualization capabilities for complex Agile reporting requirements. These tools excel at combining data from multiple sources and creating sophisticated visual representations of project metrics. They’re particularly valuable for organizations with complex reporting needs or multiple Agile teams.
Custom dashboard solutions using tools like Grafana or building internal applications provide maximum flexibility for unique reporting requirements. These approaches require more technical investment but offer complete control over dashboard functionality and appearance.
Advanced Reporting Techniques
Predictive Analytics in Agile
Monte Carlo simulations use historical velocity data to predict delivery dates with confidence intervals. This statistical approach provides more realistic timeline estimates than simple linear projections, helping stakeholders understand delivery uncertainty and make informed decisions about scope and scheduling.
Machine learning algorithms can identify patterns in team performance and suggest optimizations for future sprints. These insights help teams continuously improve their processes and delivery capabilities based on data-driven recommendations.
Cross-Team Portfolio Reporting
Portfolio-level dashboards aggregate metrics across multiple Agile teams to provide organizational insights. These views help identify best practices, resource allocation opportunities, and areas needing additional support or training.
Dependency tracking across teams visualizes inter-team relationships and potential coordination challenges. This visibility helps with program-level planning and risk management in large-scale Agile implementations.
Best Practices for Agile Reporting
Establishing Reporting Rhythms
Daily stand-up meetings benefit from quick dashboard reviews to identify impediments and track sprint progress. These brief check-ins keep the team aligned and focused on sprint goals while identifying issues early when they’re easier to resolve.
Sprint review meetings use dashboard data to demonstrate completed work and discuss lessons learned. Retrospective meetings examine metrics trends to identify improvement opportunities and track the effectiveness of process changes implemented in previous sprints.
Maintaining Data Quality
Regular data audits ensure reporting accuracy and identify inconsistencies in data collection processes. Automated validation rules can flag unusual patterns or missing data that might indicate problems with data collection or team practices.
Team training on proper data entry and tool usage prevents common data quality issues. Clear guidelines and regular reminders help maintain consistent data collection practices across team members and projects.
Common Pitfalls and Solutions
Avoiding Metric Overload
Too many metrics can overwhelm teams and obscure important insights. Focus on a core set of actionable metrics that directly support decision-making and continuous improvement. Regularly review and eliminate metrics that don’t provide value or drive action.
Vanity metrics that look impressive but don’t correlate with actual success can mislead teams and stakeholders. Ensure all reported metrics connect to meaningful outcomes and support the team’s improvement efforts.
Preventing Gaming of Metrics
When metrics become targets, teams may optimize for the measurement rather than the underlying goal. Emphasize the purpose behind each metric and use multiple indicators to provide a complete picture of team performance and project health.
Regular metric reviews and adjustments prevent teams from gaming specific measurements. Rotate focus areas and continuously align metrics with current team goals and challenges to maintain their effectiveness as improvement tools.
Future of Agile Reporting
AI-Powered Insights
Artificial intelligence will increasingly provide automated insights and recommendations based on project data patterns. These systems will identify risks, suggest optimizations, and predict project outcomes with greater accuracy than human analysis alone.
Natural language processing will enable conversational interfaces for dashboard interaction, allowing stakeholders to ask questions and receive insights in plain English rather than navigating complex dashboard interfaces.
Enhanced Collaboration Features
Future Agile reporting tools will integrate more deeply with communication platforms, providing contextual project updates within team collaboration spaces. Real-time collaboration on dashboard insights will enable more effective distributed team coordination.
Augmented reality and immersive visualization technologies may transform how teams interact with project data, providing new ways to understand complex relationships and patterns in Agile projects.
Implementing Agile Reporting Successfully
Start with basic metrics and dashboards, then gradually add complexity as teams become comfortable with Agile reporting practices. Focus on delivering immediate value through simple, clear visualizations before investing in advanced analytics capabilities.
Involve team members in dashboard design and metric selection to ensure reporting meets actual needs rather than theoretical requirements. Regular feedback sessions help refine reporting approaches and maintain alignment with evolving team needs and project goals.
Remember that the goal of Agile reporting is to enable better decision-making and continuous improvement, not to create impressive dashboards. Every reporting element should serve a clear purpose in supporting team success and stakeholder communication.
Related Posts
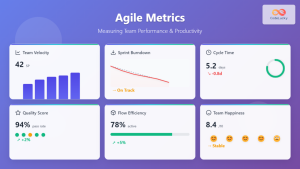
Agile Metrics: Complete Guide to Measuring Team Performance and Productivity
Measuring team performance in agile environments requires a strategic approach that goes beyond traditional project management metrics. Agile metrics provide...
Performance Management: Agile Approach to Modern Reviews and Continuous Feedback
Understanding Agile Performance Management Traditional performance reviews often fail to capture the dynamic nature of modern software development teams. Agile...
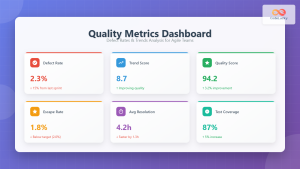
Quality Metrics: Defect Rates and Trends – Complete Guide for Agile Teams
Understanding Quality Metrics in Agile Development Quality metrics serve as the compass for Agile teams navigating the complex landscape of...
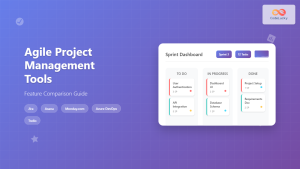
Agile Project Management Tools: Complete Feature Comparison Guide 2025
Selecting the right Agile project management tool can make or break your team's productivity and project success. With dozens of...
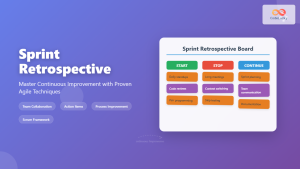
Sprint Retrospective: Master Continuous Improvement with Proven Agile Techniques
Sprint retrospectives are the cornerstone of continuous improvement in Agile development, yet many teams struggle to extract meaningful insights from...
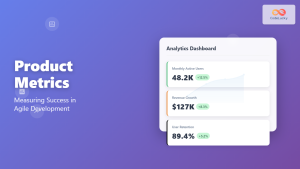
Product Metrics: Key Performance Indicators for Measuring Agile Product Success
Understanding Product Metrics in Agile Development Product metrics serve as the compass that guides Agile teams toward delivering genuine value...
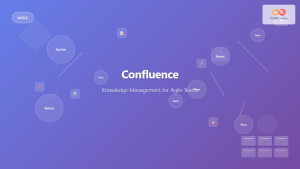
Confluence: Complete Knowledge Management Guide for Agile Teams
Knowledge management forms the backbone of successful Agile teams, and Confluence stands as one of the most powerful platforms for...
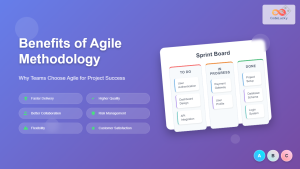
Benefits of Agile Methodology: Why Teams Choose Agile for Project Success
Agile methodology has revolutionized how teams approach project management and software development. Since its introduction through the Agile Manifesto in...
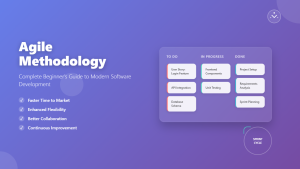
What is Agile Methodology: Complete Beginner’s Guide to Modern Software Development
Agile methodology has revolutionized how software development teams work, moving away from rigid traditional approaches to embrace flexibility, collaboration, and...
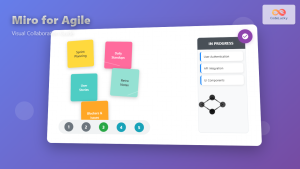
Miro for Agile: Complete Guide to Visual Collaboration and Team Productivity
Visual collaboration has become the cornerstone of successful Agile teams, especially in today's distributed work environment. Miro stands out as...
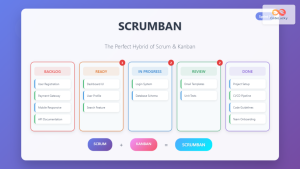
Scrumban: The Ultimate Hybrid Methodology for Agile Teams
What is Scrumban? Scrumban is a hybrid agile methodology that combines the structured framework of Scrum with the visual workflow...
Velocity: Team Throughput Measurement in Agile Development
Velocity stands as one of the most critical metrics in Agile development, serving as the heartbeat of team performance measurement....