Velocity is one of the most crucial metrics in Scrum that helps teams measure their performance and plan future sprints effectively. Understanding how to calculate, interpret, and improve velocity can transform your team’s productivity and predictability in delivering value.
What is Velocity in Scrum?
Velocity in Scrum represents the amount of work a development team can complete during a single sprint, typically measured in story points or hours. This metric serves as a historical record of team productivity and acts as a foundation for future sprint planning and project forecasting.
Unlike traditional productivity metrics that focus on individual performance, Scrum velocity measures the collective output of the entire team. This approach aligns with Agile principles that emphasize team collaboration over individual achievements.
Why Velocity Matters in Agile Development
Velocity provides several critical benefits for Scrum teams:
Predictable Sprint Planning: Teams can use historical velocity data to determine how much work they can realistically commit to in upcoming sprints, reducing overcommitment and underdelivery.
Stakeholder Communication: Velocity offers a transparent way to communicate team capacity and project timelines to stakeholders, setting realistic expectations for delivery dates.
Continuous Improvement: By tracking velocity trends over time, teams can identify patterns, bottlenecks, and opportunities for process improvements.
Resource Planning: Organizations can make informed decisions about team composition, skill development, and resource allocation based on velocity insights.
How to Calculate Scrum Velocity
Calculating velocity involves several steps that teams should follow consistently:
Step 1: Establish Story Point Estimation
Before measuring velocity, teams must have a consistent approach to estimating user stories. Most teams use the Fibonacci sequence (1, 2, 3, 5, 8, 13, 21) for story point estimation, where each number represents the relative complexity and effort required.
Step 2: Track Completed Work
During each sprint, record the story points for all user stories that meet the Definition of Done. Only fully completed work should count toward velocity calculation – partially completed stories contribute zero points.
Step 3: Calculate Sprint Velocity
Sprint velocity equals the total story points of completed user stories within a single sprint. For example, if a team completes stories worth 5, 8, 3, and 2 story points, their sprint velocity is 18 points.
Step 4: Determine Team Velocity
Team velocity represents the average of multiple sprint velocities, typically calculated over 3-6 recent sprints. This average provides a more stable and reliable metric for planning purposes than individual sprint results.
Different Methods to Measure Velocity
Teams can choose from several approaches to measure velocity based on their context and preferences:
Story Points Method
The most common approach uses relative story point estimation to measure velocity. This method focuses on complexity and effort rather than time, making it more adaptable to different types of work and team members.
Hours-Based Measurement
Some teams prefer measuring velocity in hours, especially when working on maintenance tasks or projects with well-defined time requirements. However, this approach can be less flexible and may encourage time-based thinking over value delivery.
Feature Count Method
For teams working on similar-sized features, counting completed features can serve as a simple velocity metric. This method works best when features have relatively consistent complexity and size.
Hybrid Approaches
Advanced teams might combine multiple measurement methods, using story points for development work while tracking hours for support activities or using different scales for different work types.
Factors Affecting Team Velocity
Understanding the factors that influence velocity helps teams interpret their metrics accurately and identify improvement opportunities:
Team Composition and Stability
Velocity fluctuates when team members join or leave the team. New members need time to understand the codebase, processes, and team dynamics, temporarily reducing overall velocity until they become fully productive.
Technical Debt and Code Quality
Accumulated technical debt slows down development velocity as teams spend more time working around existing issues. Investing in code quality and technical debt reduction often leads to sustained velocity improvements.
External Dependencies
Dependencies on other teams, third-party services, or external approval processes can significantly impact velocity. Teams should identify and manage these dependencies proactively.
Sprint Planning Quality
Well-planned sprints with clear acceptance criteria and properly refined user stories typically result in higher velocity compared to sprints with poorly defined requirements.
Learning and Skill Development
Teams working with new technologies or domains may initially have lower velocity while they build expertise. This investment in learning typically pays off with improved velocity in subsequent sprints.
Using Velocity for Sprint Planning
Effective sprint planning relies heavily on velocity data to create realistic and achievable sprint goals:
Capacity Planning
Use average team velocity as the baseline for sprint capacity, adjusting for known factors like team member availability, holidays, or planned learning activities. Avoid consistently planning above or below historical velocity without clear justification.
Buffer Management
Smart teams build small buffers into their sprint planning to account for unexpected issues or scope changes. This buffer might represent 10-15% of the planned velocity, depending on the team’s historical variation.
Stretch Goals
Consider including optional stretch goals that teams can pursue if they complete their committed work early. These goals should be clearly marked as non-commitments to avoid creating unrealistic expectations.
Risk Assessment
Evaluate the risk profile of planned work when using velocity for planning. Sprints with high-risk or experimental work might require more conservative velocity targets.
Common Velocity Tracking Mistakes
Avoid these common pitfalls that can undermine the value of velocity metrics:
Gaming the System
Teams sometimes inflate story point estimates to show higher velocity numbers. This practice defeats the purpose of velocity measurement and creates inaccurate planning data.
Comparing Team Velocities
Velocity is team-specific and should never be used to compare different teams. Each team has unique contexts, skills, and estimation approaches that make cross-team comparisons meaningless and potentially harmful.
Focusing Only on Velocity Increases
While improving velocity can be positive, obsessing over velocity increases can lead to corner-cutting, technical debt accumulation, or quality compromises. Sustainable velocity is more valuable than short-term spikes.
Ignoring Velocity Variations
Large velocity variations between sprints often indicate underlying issues with planning, estimation, or external factors. Teams should investigate significant variations rather than simply averaging them out.
Using Velocity for Individual Performance
Velocity measures team performance, not individual contribution. Using velocity data for individual performance reviews violates Agile principles and can damage team collaboration.
Improving Team Velocity
Teams can take several approaches to improve their velocity sustainably:
Enhance Estimation Accuracy
Regular estimation workshops, retrospectives on estimation accuracy, and techniques like Planning Poker can help teams develop more consistent and accurate estimates.
Reduce Context Switching
Minimize interruptions and context switching by establishing clear boundaries around sprint work, dedicating specific time for support activities, and improving team focus.
Invest in Automation
Automated testing, deployment pipelines, and development tools can significantly reduce manual effort and increase the time available for value-adding development work.
Address Technical Debt
Allocate regular time for technical debt reduction, refactoring, and code quality improvements. This investment typically pays dividends in improved velocity over time.
Improve Team Skills
Provide training, pair programming opportunities, and knowledge sharing sessions to help team members develop new skills and become more versatile contributors.
Optimize Team Collaboration
Foster better communication, establish clear working agreements, and remove impediments that slow down team collaboration and decision-making.
Velocity Tracking Tools and Techniques
Various tools and techniques can help teams track and analyze their velocity effectively:
Agile Project Management Tools
Popular tools like Jira, Azure DevOps, and Trello offer built-in velocity tracking features with charts, reports, and trend analysis capabilities.
Spreadsheet-Based Tracking
Simple spreadsheet solutions can work well for smaller teams or those preferring lightweight tracking approaches. Custom spreadsheets allow for flexible reporting and analysis.
Velocity Charts
Visual representations of velocity data help teams and stakeholders understand trends, variations, and patterns more easily than raw numbers alone.
Burndown and Burnup Charts
These complementary charts show progress within sprints and help teams understand whether their velocity predictions align with actual delivery patterns.
Advanced Velocity Concepts
Experienced teams can leverage more sophisticated velocity concepts for deeper insights:
Velocity Forecasting
Statistical analysis of historical velocity data can help predict future delivery dates and identify confidence intervals for project completion estimates.
Velocity Decomposition
Breaking down velocity by work type (features, bugs, technical debt) provides insights into how teams allocate their capacity and where improvements might be most beneficial.
Predictable vs. Unpredictable Work
Distinguishing between predictable development work and unpredictable support or maintenance activities helps create more accurate velocity forecasts.
Velocity Stability Metrics
Measuring velocity variation using statistical concepts like standard deviation helps teams understand their predictability and identify opportunities for stabilization.
Velocity in Different Scrum Contexts
Velocity application varies depending on the specific Scrum implementation and organizational context:
Distributed Teams
Remote and distributed teams may experience different velocity patterns due to communication challenges, time zone differences, and collaboration tool limitations.
Scaled Agile Frameworks
In scaled environments like SAFe or LeSS, velocity metrics might be aggregated across multiple teams while maintaining team-level tracking for planning purposes.
Mixed Methodology Environments
Organizations transitioning to Agile or using hybrid approaches need to carefully consider how velocity fits with other project management metrics and processes.
Conclusion
Velocity serves as a powerful tool for Scrum teams to measure performance, plan sprints, and communicate with stakeholders. When used correctly, velocity metrics provide valuable insights that help teams improve their delivery predictability and identify opportunities for continuous improvement.
Remember that velocity is a means to an end, not the end itself. The ultimate goal is delivering value to customers consistently and sustainably. Use velocity as one of several metrics in your Agile toolkit, always considering the broader context of team health, product quality, and customer satisfaction.
By understanding the principles, avoiding common mistakes, and focusing on sustainable improvements, teams can harness the full potential of velocity metrics to enhance their Scrum implementation and achieve better project outcomes.
Related Posts
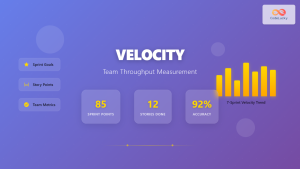
Velocity: Team Throughput Measurement in Agile Development
Velocity stands as one of the most critical metrics in Agile development, serving as the heartbeat of team performance measurement....
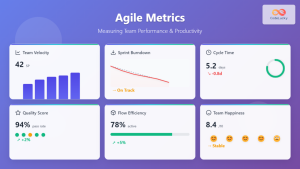
Agile Metrics: Complete Guide to Measuring Team Performance and Productivity
Measuring team performance in agile environments requires a strategic approach that goes beyond traditional project management metrics. Agile metrics provide...
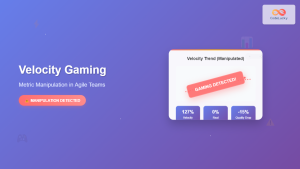
Velocity Gaming: Metric Manipulation and How to Prevent It in Agile Teams
Velocity gaming represents one of the most insidious threats to Agile team performance and organizational trust. When teams manipulate their...
Predictability: Consistency in Delivery Through Agile Methodologies
Predictability in Agile development represents the cornerstone of successful project delivery, enabling teams to establish consistent patterns that stakeholders can...

Sprint Planning: Complete Guide and Best Practices for Agile Teams
Sprint planning forms the cornerstone of successful agile development, serving as the critical bridge between product vision and executable work....
Agile Project Management Tools: Complete Feature Comparison Guide 2025
Selecting the right Agile project management tool can make or break your team's productivity and project success. With dozens of...
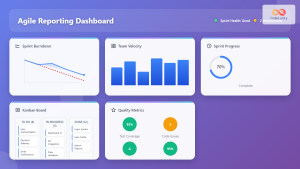
Agile Reporting: Complete Guide to Real-Time Dashboards and Performance Insights
Agile reporting transforms raw project data into actionable insights that drive successful software delivery. Unlike traditional waterfall reporting that focuses...
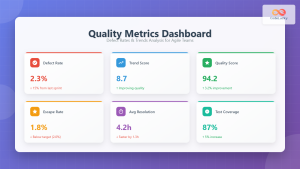
Quality Metrics: Defect Rates and Trends – Complete Guide for Agile Teams
Understanding Quality Metrics in Agile Development Quality metrics serve as the compass for Agile teams navigating the complex landscape of...
Scrum of Scrums: Complete Guide to Coordinating Multiple Agile Teams
When organizations scale their Agile practices beyond a single team, coordinating multiple Scrum teams becomes a critical challenge. Scrum of...
Agile Training: Complete Guide to Building High-Performance Team Capabilities
Agile training has become the cornerstone of modern software development and project management success. Organizations worldwide are investing heavily in...

Scrum Development Team: Complete Guide to Roles, Responsibilities and Best Practices
What is a Scrum Development Team? The Scrum Development Team is the heart of any successful Agile project, consisting of...
Sprint Review: Demonstrating Value to Stakeholders – Complete Guide for Agile Teams
The Sprint Review stands as one of the most critical ceremonies in the Scrum framework, serving as the bridge between...