Measuring team performance in agile environments requires a strategic approach that goes beyond traditional project management metrics. Agile metrics provide actionable insights into team productivity, software quality, and delivery predictability while maintaining the flexibility that makes agile methodologies so effective.
This comprehensive guide explores essential agile metrics, implementation strategies, and best practices for creating a data-driven culture that enhances team performance without compromising agile principles.
Understanding Agile Metrics Fundamentals
Agile metrics serve as quantitative indicators that help teams understand their performance patterns, identify improvement opportunities, and make informed decisions about their development processes. Unlike traditional metrics that focus on individual performance, agile metrics emphasize team collaboration and collective outcomes.
The primary purpose of agile metrics is to facilitate continuous improvement rather than performance evaluation. These measurements should encourage transparency, foster team discussions, and guide decision-making processes that align with agile values and principles.
Key Principles of Effective Agile Metrics
Successful agile metrics implementation relies on several fundamental principles that ensure measurements add value without creating unnecessary overhead or compromising team morale.
Transparency and visibility form the foundation of effective agile metrics. All team members should have access to performance data and understand how metrics are calculated and interpreted. This transparency builds trust and encourages collective ownership of improvement initiatives.
Metrics should be actionable and relevant to the team’s current context and goals. Data collection efforts should focus on measurements that directly influence decision-making and process improvements rather than vanity metrics that provide little practical value.
The continuous improvement mindset ensures that metrics evolve with the team’s maturity and changing requirements. Regular retrospectives should include discussions about metric effectiveness and adjustments to measurement strategies.
Essential Velocity Metrics for Agile Teams
Velocity represents one of the most fundamental agile metrics, providing insights into team capacity and delivery predictability. Velocity measures the amount of work completed during each iteration, typically expressed in story points, hours, or other estimation units.
Understanding velocity patterns helps teams make realistic commitments for future sprints and identify factors that influence productivity. However, velocity should never be used for performance comparisons between teams or individuals, as it reflects team-specific estimation practices and work complexity.
Calculating and Interpreting Velocity
Velocity calculation involves summing the effort estimates for all completed user stories or tasks within a specific timeframe. Teams should track velocity over multiple iterations to establish baseline performance and identify trends.
Historical velocity data enables more accurate sprint planning and release forecasting. Teams can calculate average velocity over recent sprints and use this information to estimate completion dates for larger features or releases.
Velocity fluctuations are normal and expected in agile environments. Factors such as team composition changes, external dependencies, technical debt, and learning curves for new technologies all influence velocity measurements.
Advanced Velocity Analysis Techniques
Beyond basic velocity tracking, teams can implement advanced analysis techniques to gain deeper insights into performance patterns and improvement opportunities.
Velocity trend analysis examines velocity changes over time to identify patterns related to team maturity, process improvements, or external factors. Upward trends may indicate improved estimation accuracy or process optimizations, while downward trends might signal technical debt accumulation or team challenges.
Velocity distribution analysis helps teams understand the consistency of their delivery patterns. Teams with highly variable velocity might need to focus on estimation accuracy or identifying and addressing impediments that cause significant productivity fluctuations.
Burndown and Burnup Charts for Progress Tracking
Burndown and burnup charts provide visual representations of work progress throughout sprints and releases. These charts help teams monitor their trajectory toward sprint goals and make necessary adjustments to ensure successful delivery.
Sprint burndown charts display the remaining work throughout a sprint, showing whether the team is on track to complete their commitments. The ideal burndown line represents perfect progress distribution, while the actual line shows real progress patterns.
Release burndown charts extend this concept to longer timeframes, tracking progress toward major milestones or product releases. These charts help stakeholders understand delivery timelines and make informed decisions about scope adjustments or resource allocation.
Creating Effective Burndown Charts
Effective burndown charts require careful consideration of measurement units and update frequencies. Teams should choose measurement units that accurately reflect work complexity and progress, whether using story points, task hours, or feature counts.
Daily updates ensure burndown charts provide timely feedback and enable quick responses to potential issues. Automated chart generation from project management tools reduces manual overhead and ensures consistency.
Chart interpretation requires understanding that perfect burndown rarely occurs in practice. Flat lines might indicate blocked work or incorrect initial estimates, while steep drops could suggest scope changes or estimation errors.
Burnup Charts for Enhanced Visibility
Burnup charts offer advantages over traditional burndown charts by showing both completed work and total scope changes. This dual perspective helps stakeholders understand whether delays result from scope increases or productivity issues.
Scope line tracking in burnup charts reveals how requirements changes affect delivery timelines. Teams can distinguish between productivity improvements and scope creep, leading to more informed project decisions.
Burnup charts also provide better visibility into team accomplishments, showing cumulative progress rather than focusing solely on remaining work. This positive perspective can improve team morale and stakeholder confidence.
Cycle Time and Lead Time Optimization
Cycle time and lead time metrics provide crucial insights into process efficiency and customer value delivery speed. Lead time measures the total time from request to delivery, while cycle time focuses on active work duration.
These metrics help teams identify bottlenecks, optimize workflows, and improve predictability. Shorter cycle times generally indicate more efficient processes and faster feedback loops, leading to better quality and customer satisfaction.
Measuring and Analyzing Cycle Time
Cycle time measurement requires clear definitions of work start and completion points. Teams should establish consistent criteria for when work begins and ends to ensure accurate and comparable measurements.
Workflow stage analysis breaks down cycle time into component stages, revealing where work spends the most time. This granular view helps teams identify specific bottlenecks and optimization opportunities.
Cycle time distribution analysis reveals patterns in delivery predictability. Teams with consistent cycle times can make more reliable commitments, while high variability suggests process instability or work complexity issues.
Lead Time Optimization Strategies
Lead time optimization requires examining the entire value stream from customer request to delivered value. This broader perspective often reveals opportunities outside the development team’s direct control.
Queue time analysis identifies periods when work waits between process stages. Reducing queue times through better workflow design, resource allocation, or priority management can significantly improve lead times.
Batch size optimization also impacts lead time performance. Smaller work batches typically flow through systems more quickly and provide faster feedback, leading to improved quality and reduced rework.
Quality Metrics and Defect Tracking
Quality metrics provide essential feedback about software reliability, maintainability, and customer satisfaction. Defect density, escape rates, and customer-reported issues offer different perspectives on product quality and process effectiveness.
Effective quality metrics balance prevention and detection activities, encouraging teams to build quality into their development processes rather than relying solely on testing phases.
Defect Prevention and Detection Metrics
Defect prevention metrics focus on activities that reduce defect introduction, such as code review coverage, automated testing adoption, and pair programming frequency. These leading indicators help teams improve their development practices proactively.
Code review effectiveness can be measured through metrics like review coverage percentage, defects found in reviews, and review cycle time. High-quality code reviews catch issues early and improve team knowledge sharing.
Automated testing metrics include test coverage percentages, test execution frequency, and test maintenance overhead. Comprehensive automated testing provides faster feedback and reduces manual testing burden.
Customer-Centric Quality Metrics
Customer-centric quality metrics focus on user experience and satisfaction rather than internal development metrics. These measurements provide direct feedback about product value and user satisfaction.
Customer satisfaction scores and Net Promoter Scores (NPS) provide quantitative feedback about user experience and product value. Regular customer surveys and feedback collection help teams understand quality from the user perspective.
Production incident metrics track system reliability and user impact. Mean time to detection (MTTD) and mean time to recovery (MTTR) measure the team’s ability to identify and resolve production issues quickly.
Team Collaboration and Happiness Metrics
Team collaboration and happiness metrics provide insights into team health and sustainability. Happy, collaborative teams typically deliver better results and maintain higher productivity over time.
These metrics help organizations create environments that support team success and identify potential issues before they impact delivery performance.
Measuring Team Collaboration
Collaboration metrics can include pair programming frequency, knowledge sharing activities, and cross-functional work distribution. Teams with strong collaboration patterns typically show better knowledge distribution and reduced single points of failure.
Communication effectiveness can be measured through retrospective feedback, meeting efficiency scores, and conflict resolution success rates. Effective communication reduces misunderstandings and improves decision-making speed.
Cross-training metrics track how well teams develop versatile skill sets and reduce dependencies on specific individuals. Teams with broad skill distribution show better resilience and flexibility.
Team Happiness and Engagement Indicators
Regular team happiness surveys provide quantitative feedback about job satisfaction, work-life balance, and organizational support. Anonymous surveys encourage honest feedback about team dynamics and management effectiveness.
Retention rates and voluntary turnover provide lagging indicators of team satisfaction and organizational health. High turnover can indicate systemic issues that require attention and improvement.
Employee engagement metrics include participation in improvement initiatives, knowledge sharing activities, and voluntary contributions beyond assigned work. Engaged teams typically show higher productivity and innovation.
Advanced Agile Metrics and KPIs
Advanced agile metrics provide deeper insights into process maturity and organizational agility. These measurements help mature teams optimize their practices and demonstrate business value.
Flow efficiency metrics examine how effectively work moves through development processes, revealing opportunities for waste reduction and process optimization.
Flow Efficiency and Waste Reduction
Flow efficiency measures the percentage of time work items spend in active development versus waiting states. Higher flow efficiency indicates better process design and resource utilization.
Work item aging tracks how long items remain in progress without completion. Aging work items may indicate scope creep, technical complexity, or resource constraints that require attention.
Throughput metrics measure the number of work items completed per time period, providing insights into team capacity and process effectiveness. Consistent throughput indicates stable, predictable processes.
Predictability and Forecasting Metrics
Predictability metrics help teams and stakeholders understand delivery reliability and make informed planning decisions. These measurements build confidence in agile processes and support better business planning.
Commitment reliability measures how consistently teams deliver their sprint commitments. Teams with high commitment reliability can make more confident promises to stakeholders and customers.
Forecasting accuracy tracks how well teams predict completion dates for larger initiatives. Improved forecasting accuracy enables better business planning and resource allocation decisions.
Implementation Strategies and Best Practices
Successful agile metrics implementation requires careful planning, tool selection, and cultural considerations. Teams should start with basic metrics and gradually expand their measurement practices as they gain experience and maturity.
Tool selection should prioritize ease of use, automation capabilities, and integration with existing development workflows. Manual data collection creates overhead and reduces metric sustainability.
Building a Metrics-Driven Culture
Creating a metrics-driven culture requires leadership support, team buy-in, and clear communication about metric purposes and benefits. Teams should understand that metrics support improvement rather than performance evaluation.
Regular metric reviews during retrospectives and planning sessions help teams identify trends and improvement opportunities. These discussions should focus on actionable insights rather than blame or judgment.
Metric visualization through dashboards and charts makes data accessible and understandable for all team members. Visual representations help teams quickly identify patterns and anomalies.
Avoiding Common Metrics Pitfalls
Common metrics pitfalls include measuring too many things, using metrics for individual performance evaluation, and focusing on vanity metrics that don’t drive improvement.
Gaming prevention requires careful metric design and regular evaluation of unintended consequences. Teams should focus on outcomes rather than outputs and avoid metrics that encourage counterproductive behaviors.
Metric evolution ensures measurements remain relevant as teams mature and circumstances change. Regular retrospectives should include discussions about metric effectiveness and necessary adjustments.
Tools and Technologies for Agile Metrics
Modern agile metrics tools provide automated data collection, visualization, and analysis capabilities that reduce manual overhead and improve accuracy. Integration with development tools enables seamless metric collection without disrupting team workflows.
Popular tools include Jira with Advanced Roadmaps, Azure DevOps, and specialized analytics platforms like ActionableAgile and Pluralsight Flow. Tool selection should consider team size, budget, and specific metric requirements.
Dashboard Design and Visualization
Effective dashboard design presents relevant information clearly and enables quick decision-making. Dashboards should be tailored to different audiences, from daily team standups to executive reporting.
Real-time updates ensure dashboards provide current information for decision-making. Automated data refresh reduces manual maintenance and ensures consistency across different views.
Mobile accessibility enables team members to access metrics information from anywhere, supporting distributed teams and flexible work arrangements.
Conclusion and Future Considerations
Agile metrics provide powerful tools for understanding team performance, identifying improvement opportunities, and demonstrating business value. Successful implementation requires balancing measurement with agile principles and focusing on metrics that drive meaningful improvement.
Teams should start with fundamental metrics like velocity and burndown charts, gradually expanding their measurement practices as they gain experience and maturity. Regular evaluation and adjustment of metrics ensure continued relevance and value.
The future of agile metrics lies in increased automation, predictive analytics, and integration with AI-powered insights. These advances will provide deeper understanding of team performance patterns and more proactive improvement recommendations.
Remember that metrics are tools to support team success, not ends in themselves. The most effective agile metrics programs maintain focus on continuous improvement, team collaboration, and customer value delivery while providing the insights needed for informed decision-making.
Related Posts
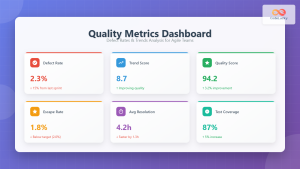
Quality Metrics: Defect Rates and Trends – Complete Guide for Agile Teams
Understanding Quality Metrics in Agile Development Quality metrics serve as the compass for Agile teams navigating the complex landscape of...
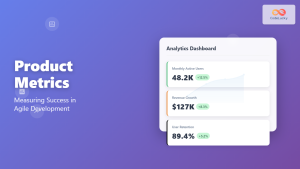
Product Metrics: Key Performance Indicators for Measuring Agile Product Success
Understanding Product Metrics in Agile Development Product metrics serve as the compass that guides Agile teams toward delivering genuine value...
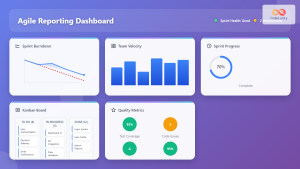
Agile Reporting: Complete Guide to Real-Time Dashboards and Performance Insights
Agile reporting transforms raw project data into actionable insights that drive successful software delivery. Unlike traditional waterfall reporting that focuses...
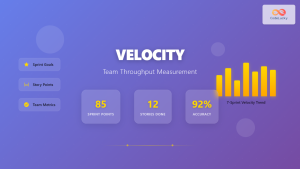
Velocity: Team Throughput Measurement in Agile Development
Velocity stands as one of the most critical metrics in Agile development, serving as the heartbeat of team performance measurement....
Performance Management: Agile Approach to Modern Reviews and Continuous Feedback
Understanding Agile Performance Management Traditional performance reviews often fail to capture the dynamic nature of modern software development teams. Agile...
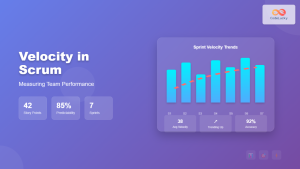
Velocity in Scrum: The Complete Guide to Measuring and Improving Team Performance
Velocity is one of the most crucial metrics in Scrum that helps teams measure their performance and plan future sprints...
Agile Training: Complete Guide to Building High-Performance Team Capabilities
Agile training has become the cornerstone of modern software development and project management success. Organizations worldwide are investing heavily in...
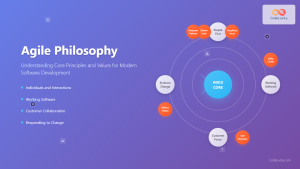
Agile Philosophy: Understanding Core Principles and Values for Modern Software Development
Introduction to Agile Philosophy Agile philosophy represents a fundamental shift in how software development teams approach project management, collaboration, and...
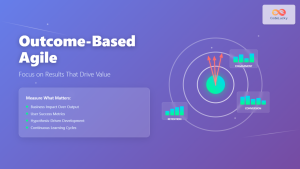
Outcome-Based Agile: Focus on Results That Drive Business Value
Traditional Agile methodologies often fall into the trap of measuring success by output metrics like story points completed, features delivered,...
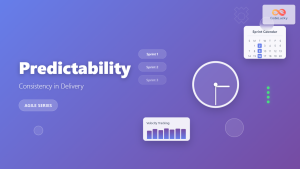
Predictability: Consistency in Delivery Through Agile Methodologies
Predictability in Agile development represents the cornerstone of successful project delivery, enabling teams to establish consistent patterns that stakeholders can...
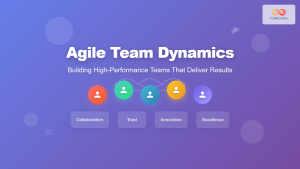
Agile Team Dynamics: Building High-Performance Teams That Deliver Results
Agile team dynamics form the backbone of successful software development projects, determining whether teams thrive or struggle in today's fast-paced...
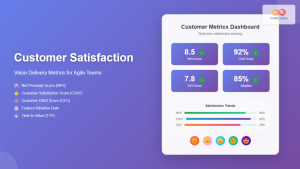
Customer Satisfaction: Value Delivery Metrics for Agile Teams
In today's competitive software landscape, customer satisfaction serves as the ultimate measure of Agile team success. While traditional metrics focus...