Understanding Product Metrics in Agile Development
Product metrics serve as the compass that guides Agile teams toward delivering genuine value to users and stakeholders. In today’s data-driven landscape, successful product development relies heavily on measuring the right indicators at the right time. These metrics provide actionable insights that help teams make informed decisions, prioritize features, and validate assumptions about user behavior and market demands.
Unlike traditional project management approaches that focus primarily on timeline and budget adherence, Agile product metrics emphasize outcomes over outputs. This fundamental shift enables teams to measure what truly matters: customer satisfaction, business value creation, and product-market fit. By establishing a comprehensive metrics framework, organizations can track progress toward strategic goals while maintaining the flexibility to adapt based on real-world feedback.
Categories of Product Metrics
Business Value Metrics
Business value metrics directly correlate product activities with organizational objectives and financial outcomes. These metrics help stakeholders understand the return on investment and strategic impact of product decisions.
Revenue Metrics: Monthly Recurring Revenue (MRR), Annual Recurring Revenue (ARR), and Customer Lifetime Value (CLV) provide clear indicators of financial health. These metrics help teams understand how product changes affect revenue streams and customer retention patterns.
Cost Metrics: Customer Acquisition Cost (CAC), Cost Per Lead (CPL), and operational expenses related to product development help teams optimize resource allocation and identify areas for efficiency improvements.
Profitability Indicators: Gross margin, profit per customer, and return on investment (ROI) metrics enable teams to evaluate the financial sustainability of product features and initiatives.
User Experience and Engagement Metrics
User-centric metrics reveal how effectively the product meets customer needs and expectations. These indicators help teams understand user behavior patterns and identify opportunities for improvement.
Activation Metrics: Time to first value, onboarding completion rates, and feature adoption rates indicate how quickly users derive benefit from the product. High activation rates suggest effective user experience design and clear value proposition communication.
Retention Metrics: Daily Active Users (DAU), Weekly Active Users (WAU), Monthly Active Users (MAU), and churn rates provide insights into long-term user engagement and product stickiness. These metrics help teams identify when and why users disengage from the product.
Satisfaction Indicators: Net Promoter Score (NPS), Customer Satisfaction Score (CSAT), and Customer Effort Score (CES) measure user sentiment and likelihood to recommend the product to others.
Product Performance Metrics
Technical and operational metrics ensure the product delivers reliable, high-quality experiences that support user engagement and business objectives.
Quality Metrics: Defect density, bug resolution time, and system uptime directly impact user experience and operational costs. Maintaining high quality standards reduces support overhead and improves user satisfaction.
Performance Indicators: Page load times, response times, and system throughput affect user engagement and conversion rates. Poor performance can significantly impact user retention and business outcomes.
Reliability Measures: Mean Time Between Failures (MTBF), Mean Time To Recovery (MTTR), and availability percentages help teams maintain service level agreements and user trust.
Implementing a Metrics-Driven Approach
Establishing Baseline Measurements
Before implementing changes or new features, teams must establish baseline measurements for key metrics. This foundational step enables accurate assessment of improvement efforts and provides context for future decision-making. Baseline establishment involves collecting historical data, identifying normal ranges for key indicators, and documenting measurement methodologies to ensure consistency over time.
Data collection infrastructure plays a crucial role in baseline establishment. Teams should implement robust analytics platforms, establish data governance practices, and ensure measurement accuracy through regular validation exercises. This infrastructure investment pays dividends throughout the product lifecycle by enabling rapid experimentation and data-driven decision making.
Setting Meaningful Goals and Targets
Effective goal setting requires balancing ambition with achievability while aligning individual metrics with broader organizational objectives. SMART criteria (Specific, Measurable, Achievable, Relevant, Time-bound) provide a framework for establishing meaningful targets that motivate teams without creating unrealistic expectations.
Goal hierarchies help connect tactical metrics with strategic outcomes. For example, improving page load times (tactical) should connect to increased user engagement (operational) which ultimately drives revenue growth (strategic). This alignment ensures that optimization efforts contribute to meaningful business outcomes rather than isolated improvements.
Creating Feedback Loops
Rapid feedback loops enable teams to learn quickly from metric changes and adjust strategies accordingly. Short feedback cycles reduce the risk of pursuing ineffective approaches for extended periods and increase the likelihood of discovering successful optimization strategies.
Regular review cycles, automated alerting systems, and dashboard visualization help teams maintain awareness of metric trends and respond promptly to significant changes. These systems should balance comprehensive coverage with focused attention on the most critical indicators for current objectives.
Advanced Metrics and Analytics
Cohort Analysis
Cohort analysis reveals how user behavior changes over time by grouping users based on shared characteristics or time periods. This analytical approach helps teams understand the long-term impact of product changes and identify patterns that aren’t visible in aggregate metrics.
User cohorts can be defined by acquisition date, feature usage, geographic location, or any other relevant characteristic. By tracking cohort performance over time, teams can identify which user segments provide the highest lifetime value and tailor product development efforts accordingly.
Funnel Analysis
Funnel analysis tracks user progression through key workflows and identifies bottlenecks that prevent desired outcomes. This technique is particularly valuable for optimizing conversion processes, onboarding flows, and feature adoption sequences.
Multi-step funnel analysis reveals where users encounter friction and provides specific targets for optimization efforts. By measuring conversion rates at each funnel stage, teams can prioritize improvements based on potential impact and implementation complexity.
A/B Testing and Experimentation
Controlled experimentation enables teams to validate hypotheses and measure the causal impact of product changes. A/B testing provides statistical confidence in decision-making and reduces the risk of implementing changes that don’t deliver expected benefits.
Experiment design requires careful consideration of sample sizes, statistical significance, and confounding variables. Teams should establish clear success criteria before launching experiments and maintain rigorous documentation of test parameters and results.
Tools and Technologies for Product Metrics
Analytics Platforms
Modern analytics platforms provide comprehensive measurement capabilities that support various metric types and analysis methods. Popular solutions include Google Analytics, Mixpanel, Amplitude, and custom-built analytics systems tailored to specific product requirements.
Platform selection should consider integration capabilities, scalability requirements, privacy compliance, and team technical expertise. Many organizations benefit from combining multiple platforms to leverage specific strengths while maintaining comprehensive coverage of key metrics.
Business Intelligence Tools
Business intelligence platforms enable advanced analysis and visualization of product metrics alongside other organizational data sources. Tools like Tableau, Power BI, and Looker help teams create compelling dashboards and reports that communicate insights effectively to various stakeholder groups.
Data warehouse integration allows teams to combine product metrics with customer data, financial information, and operational metrics for comprehensive business analysis. This holistic view enables more informed strategic decision-making and better alignment between product and business objectives.
Real-time Monitoring Solutions
Real-time monitoring systems provide immediate visibility into critical product metrics and enable rapid response to issues or opportunities. These systems typically include alerting mechanisms, automated anomaly detection, and integration with incident response workflows.
Monitoring infrastructure should balance comprehensive coverage with noise reduction to ensure teams focus attention on genuinely important events. Effective alerting strategies use multiple notification channels and escalation procedures to ensure critical issues receive appropriate attention.
Common Pitfalls and Best Practices
Avoiding Vanity Metrics
Vanity metrics provide impressive numbers that don’t correlate with meaningful business outcomes. Examples include total page views, social media followers, or app downloads without considering engagement quality or conversion to valuable actions.
Teams should focus on actionable metrics that directly influence decision-making and connect to business objectives. Each metric should have a clear relationship to user value creation or business performance improvement.
Balancing Leading and Lagging Indicators
Leading indicators predict future performance and enable proactive decision-making, while lagging indicators confirm past results. Effective metrics frameworks include both types to provide comprehensive visibility into product performance trends.
Leading indicators might include user engagement patterns, feature adoption rates, or customer satisfaction scores. Lagging indicators typically focus on revenue, retention, and long-term business outcomes. Teams should monitor both types to maintain strategic awareness while enabling tactical optimization.
Managing Data Quality and Accuracy
Poor data quality undermines the entire metrics framework and can lead to misguided decisions with significant negative consequences. Teams must establish data validation processes, regular accuracy audits, and clear documentation of measurement methodologies.
Data governance practices should address collection standards, storage procedures, access controls, and privacy compliance requirements. Regular training ensures team members understand proper measurement techniques and interpretation guidelines.
Scaling Metrics Across Teams and Organizations
Standardizing Measurement Approaches
As organizations grow, consistent measurement approaches become critical for effective communication and decision-making across teams. Standardization efforts should address metric definitions, calculation methods, reporting formats, and review processes.
Center of Excellence teams can help establish best practices, provide training resources, and maintain consistency as new teams adopt metrics-driven approaches. These teams should balance standardization benefits with flexibility for team-specific requirements.
Creating Metrics Hierarchies
Organizational metrics hierarchies connect individual team metrics with department and company-level objectives. This alignment ensures that local optimization efforts contribute to broader strategic goals while maintaining team autonomy in tactical execution.
Hierarchical structures should clearly define relationships between different metric levels and establish accountability for outcomes at each organizational tier. Regular alignment reviews help maintain consistency as business priorities evolve.
Building Analytics Capabilities
Sustainable metrics programs require organizational investment in analytics capabilities, including technical infrastructure, analytical skills, and data-driven decision-making processes. This capability building enables teams to extract maximum value from measurement investments.
Training programs should address technical skills, statistical literacy, and strategic thinking about metric selection and interpretation. Organizations should also invest in tools and platforms that enable self-service analytics while maintaining data governance standards.
Future Trends in Product Metrics
Artificial Intelligence and Machine Learning
AI and ML technologies are revolutionizing product metrics by enabling automated pattern recognition, predictive analytics, and anomaly detection. These capabilities help teams identify opportunities and issues that might not be apparent through traditional analysis methods.
Machine learning models can predict user behavior, identify at-risk customers, and recommend optimization strategies based on historical patterns and real-time data. However, teams must balance automation benefits with human judgment and domain expertise.
Privacy-First Analytics
Increasing privacy regulations and user awareness are driving adoption of privacy-preserving analytics approaches. These methods enable meaningful measurement while protecting individual user privacy and complying with regulatory requirements.
Techniques include differential privacy, federated learning, and server-side analytics that reduce client-side tracking requirements. Teams must adapt measurement strategies to maintain insights while respecting user privacy preferences and regulatory constraints.
Real-time Decision Making
Advanced analytics platforms increasingly support real-time decision-making through automated experimentation, dynamic personalization, and adaptive user experiences. These capabilities enable products to respond immediately to changing user needs and market conditions.
Real-time systems require robust infrastructure, clear decision-making frameworks, and appropriate safeguards to prevent automated systems from making harmful decisions. Teams should gradually expand real-time capabilities while maintaining human oversight of critical decisions.
Conclusion
Product metrics serve as the foundation for successful Agile product development by providing objective insights into user needs, business performance, and product quality. Effective metrics programs require careful planning, robust infrastructure, and ongoing commitment to data-driven decision-making.
Organizations that invest in comprehensive metrics capabilities gain significant competitive advantages through faster learning cycles, better resource allocation, and more effective product optimization. As the product development landscape continues evolving, metrics-driven approaches will become increasingly critical for delivering value in competitive markets.
Success with product metrics requires balancing technical implementation with strategic thinking, ensuring that measurement efforts contribute to meaningful outcomes rather than mere data collection. Teams that master this balance will be well-positioned to deliver exceptional products that delight users and achieve business objectives.
Related Posts
Agile Metrics: Complete Guide to Measuring Team Performance and Productivity
Measuring team performance in agile environments requires a strategic approach that goes beyond traditional project management metrics. Agile metrics provide...
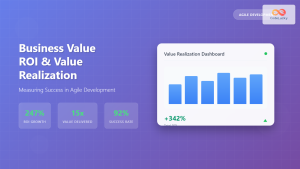
Business Value: ROI and Value Realization in Agile Development
In today's competitive business landscape, organizations investing in Agile development need more than just faster delivery—they need demonstrable business value....
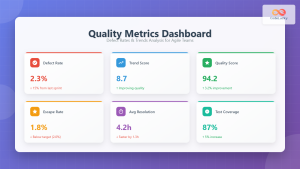
Quality Metrics: Defect Rates and Trends – Complete Guide for Agile Teams
Understanding Quality Metrics in Agile Development Quality metrics serve as the compass for Agile teams navigating the complex landscape of...
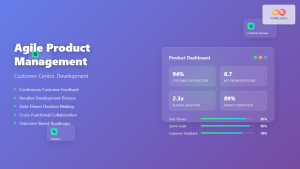
Agile Product Management: Complete Guide to Customer-Centric Development Success
What is Agile Product Management? Agile Product Management is a strategic approach that combines traditional product management principles with agile...
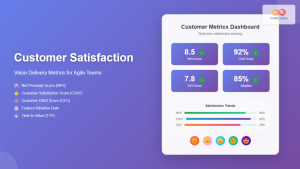
Customer Satisfaction: Value Delivery Metrics for Agile Teams
In today's competitive software landscape, customer satisfaction serves as the ultimate measure of Agile team success. While traditional metrics focus...

Build-Measure-Learn: Complete Guide to Iterative Product Development Success
The Build-Measure-Learn cycle stands as one of the most powerful frameworks in modern product development, transforming how teams approach innovation...
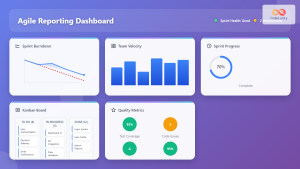
Agile Reporting: Complete Guide to Real-Time Dashboards and Performance Insights
Agile reporting transforms raw project data into actionable insights that drive successful software delivery. Unlike traditional waterfall reporting that focuses...

Outcome-Based Agile: Focus on Results That Drive Business Value
Traditional Agile methodologies often fall into the trap of measuring success by output metrics like story points completed, features delivered,...
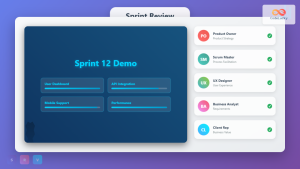
Sprint Review: Demonstrating Value to Stakeholders – Complete Guide for Agile Teams
The Sprint Review stands as one of the most critical ceremonies in the Scrum framework, serving as the bridge between...

Product Vision: Complete Guide to Defining Long-term Product Direction
A product vision serves as the North Star for your entire product development journey, providing clear direction and purpose that...
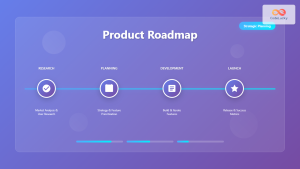
Product Roadmap: Complete Guide to Strategic Planning and Execution
A product roadmap serves as the strategic backbone of successful product development, providing a visual timeline that connects your product...
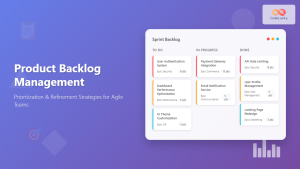
Product Backlog Management: Complete Guide to Prioritization and Refinement Strategies
Product backlog management forms the cornerstone of successful Agile development, directly impacting team productivity, stakeholder satisfaction, and project outcomes. As...