What is Value Stream Mapping in Software Development?
Value Stream Mapping (VSM) is a lean management technique that visualizes the entire flow of materials, information, and activities required to deliver a product or service to customers. In software development, it provides a comprehensive view of your development process from initial concept to production deployment, helping teams identify inefficiencies, bottlenecks, and opportunities for improvement.
Originally developed in manufacturing by Toyota as part of their lean production system, value stream mapping has been successfully adapted to software development environments. It serves as a powerful diagnostic tool that reveals hidden waste in your development pipeline and provides actionable insights for process optimization.
Why Value Stream Mapping Matters for Agile Teams
Modern software development faces increasing pressure to deliver high-quality products faster while maintaining efficiency. Value stream mapping addresses these challenges by providing visibility into the entire development ecosystem. When teams can see their complete workflow visualized, they gain the ability to make data-driven decisions about process improvements.
The primary benefits include improved cycle times, reduced lead times, enhanced quality through better process control, and increased team collaboration through shared understanding of the development flow. Organizations implementing VSM typically see 20-40% improvements in delivery speed and significant reductions in defect rates.
Core Components of Development Value Streams
Information Flow
Information flow represents how requirements, specifications, feedback, and decisions move through your development process. This includes user stories flowing from product owners to development teams, design specifications moving from UX teams to developers, and feedback traveling from QA back to development.
Understanding information flow helps identify communication bottlenecks, unclear handoffs, and areas where information gets lost or distorted. Common issues include requirements that change during development without proper communication channels, or feedback loops that take too long to complete.
Material Flow
In software development, material flow refers to the movement of code, artifacts, and deliverables through different stages. This includes source code moving through version control systems, build artifacts progressing through deployment pipelines, and documentation flowing alongside development activities.
Tracking material flow reveals integration challenges, deployment bottlenecks, and areas where manual processes slow down automation. Teams often discover that their biggest delays occur not in coding, but in the movement of code through various environments and approval processes.
Process Steps and Activities
Each stage in your development process represents a distinct activity that adds value or transforms the product. These typically include planning, design, development, code review, testing, staging, and deployment. Each step should be clearly defined with specific inputs, outputs, and success criteria.
Documenting process steps helps identify redundant activities, unclear responsibilities, and steps that don’t add clear value to the end product. Many teams discover they have unnecessary approval steps or duplicate quality checks that slow down delivery without improving outcomes.
Creating Your First Value Stream Map
Current State Mapping
Begin by mapping your current development process exactly as it exists today, including all the inefficiencies and problems. Start with a specific product or feature and trace its journey from initial concept to production deployment. Gather your entire team including developers, testers, product owners, and operations personnel.
Walk through each step chronologically, documenting the actual process rather than the ideal process. Include waiting times, rework loops, approval delays, and manual handoffs. Use sticky notes or digital tools to capture each activity, decision point, and handoff between team members or systems.
Key metrics to capture include processing time (how long work actually takes), wait time (how long work sits idle), cycle time (total time from start to finish), and quality metrics like defect rates or rework percentages. Don’t forget to document information flow alongside the physical process flow.
Future State Design
Once you understand your current state, design your ideal future state by eliminating waste, reducing delays, and improving flow. Focus on removing non-value-added activities, reducing batch sizes, implementing pull systems, and creating continuous flow where possible.
Apply lean principles such as eliminating overproduction (building features before they’re needed), reducing waiting (long approval processes), minimizing transportation (unnecessary handoffs), avoiding overprocessing (gold-plating features), and preventing defects through better quality practices.
Consider automation opportunities, improved tooling, better communication channels, and streamlined approval processes. The future state should be achievable within 6-12 months with focused improvement efforts.
Identifying Waste in Development Processes
The Eight Wastes of Software Development
Partially Done Work: Incomplete features, unfinished documentation, or code that sits in development branches without being integrated. This waste ties up resources and provides no value until completed.
Extra Features: Building functionality that customers don’t need or want. This includes over-engineering solutions, adding unnecessary complexity, or implementing features based on assumptions rather than validated customer needs.
Relearning: Time spent figuring out what someone else already knows due to poor documentation, knowledge silos, or team turnover. This waste multiplies when tribal knowledge isn’t captured and shared effectively.
Handoffs: Each time work passes from one person or team to another, there’s potential for miscommunication, delays, and quality issues. Excessive handoffs create bottlenecks and increase the risk of defects.
Delays: Waiting for approvals, environments, resources, or decisions. These delays accumulate throughout the development process and significantly impact overall cycle time.
Task Switching: When team members work on multiple projects simultaneously, they lose productivity due to context switching overhead. This waste reduces focus and increases the likelihood of errors.
Defects: Bugs, errors, and quality issues that require rework. Beyond the immediate cost of fixing, defects create cascading delays and can damage customer relationships.
Motion: Unnecessary movement of people, information, or artifacts. In software development, this often manifests as inefficient tools, poor workspace organization, or cumbersome processes that require extra steps.
Root Cause Analysis Techniques
When you identify waste in your value stream, use root cause analysis to understand underlying issues. The “Five Whys” technique works well for most development problems. Start with the observed waste and keep asking “why” until you reach the fundamental cause.
For example, if you notice long delays in code reviews, ask why reviews take so long. Perhaps reviewers are too busy with other tasks. Why are they too busy? Maybe the team doesn’t have enough senior developers. Why don’t they have enough senior developers? Continue until you reach actionable root causes.
Fishbone diagrams help visualize multiple contributing factors to a problem. Create categories like People, Process, Technology, and Environment, then brainstorm potential causes under each category. This technique prevents tunnel vision and ensures you consider all possible contributing factors.
Key Metrics and Measurements
Flow Metrics
Lead Time: The total time from when a customer request is made until it’s delivered to production. This metric reflects the customer’s experience and includes all processing time, wait time, and delays.
Cycle Time: The time from when work begins until it’s completed. This focuses on the efficiency of your development process and excludes time spent in backlogs or queues.
Throughput: The number of features, stories, or requests completed per unit of time. This metric helps you understand your team’s capacity and predict future delivery.
Work in Progress (WIP): The amount of work currently active in your system. High WIP often indicates bottlenecks and can lead to longer cycle times and reduced focus.
Quality Metrics
Defect Rate: The percentage of work items that require rework or contain defects. Track this by development stage to identify where quality issues originate.
Rework Percentage: The amount of time spent fixing previously completed work. High rework rates indicate process problems or insufficient quality practices.
First-Pass Yield: The percentage of work that passes through each stage without requiring rework. This metric helps identify stages with quality problems.
Escaped Defects: Issues that reach production despite your quality processes. These are particularly costly and impact customer satisfaction.
Efficiency Metrics
Process Efficiency: The ratio of value-added time to total lead time. Low efficiency indicates excessive waste in your process.
Resource Utilization: How effectively you’re using your team’s capacity. Both under-utilization and over-utilization can indicate process problems.
Batch Size: The amount of work processed together through your system. Smaller batch sizes typically lead to faster feedback and better flow.
Queue Time: Time work spends waiting between process steps. Long queue times often indicate bottlenecks or imbalanced capacity.
Digital Tools for Value Stream Mapping
Specialized VSM Software
Lucidchart: Offers dedicated value stream mapping templates with drag-and-drop functionality. Includes collaboration features and integrates with popular development tools. Particularly strong for teams that need to share maps with stakeholders outside the development team.
Visio: Microsoft’s diagramming tool includes VSM templates and shapes. Integrates well with other Microsoft products and offers advanced formatting options. Best suited for organizations already using Microsoft toolchains.
ValueStreamGuru: Purpose-built for value stream mapping with features like automatic metric calculations and improvement tracking. Includes industry-specific templates and best practices guidance.
General Purpose Tools
Miro/Mural: Digital whiteboard platforms excellent for collaborative mapping sessions. Offer sticky notes, templates, and real-time collaboration features. Particularly effective for remote teams or workshop-style mapping sessions.
Draw.io (now diagrams.net): Free, web-based diagramming tool with VSM capabilities. Integrates with Google Drive, Confluence, and other platforms. Good option for teams with budget constraints.
Creately: Cloud-based diagramming with VSM templates and real-time collaboration. Includes data linking features that can connect your maps to actual performance metrics.
Integrated Development Analytics
Azure DevOps Analytics: Provides built-in flow metrics and visualization for teams using Microsoft’s development platform. Automatically tracks cycle time, lead time, and throughput.
Jira with Advanced Roadmaps: Atlassian’s project management tool includes flow diagrams and metrics tracking. Can automatically generate value stream insights from your existing project data.
Linear: Modern project management tool with built-in cycle time tracking and flow visualization. Particularly popular with fast-moving development teams.
Implementation Best Practices
Getting Started
Begin with a pilot project or specific product area rather than trying to map your entire organization at once. Choose a value stream that’s important to your business but not so complex that it becomes overwhelming. Aim for a process that typically takes 2-8 weeks from start to finish.
Involve the right people from the beginning. Include team members who actually do the work, not just managers who think they know how the work gets done. You need perspectives from development, testing, operations, product management, and any other groups involved in delivery.
Set clear expectations about the time investment required. Initial mapping typically takes 4-8 hours spread across multiple sessions. Follow-up improvement activities require ongoing commitment from the team.
Facilitation Techniques
Use the “spaghetti diagram” approach for complex processes. Have team members physically walk through the process, drawing lines on a floor plan or diagram to show how work moves through different areas, systems, or people. This reveals hidden complexity and unnecessary movement.
Implement “gemba walks” where you observe the actual work being done rather than relying on how people think the work gets done. Spend time with developers as they code, testers as they test, and operations teams as they deploy. The reality often differs significantly from documented processes.
Use time-boxing to keep mapping sessions focused and productive. Limit initial mapping to 2-3 hours per session, and schedule multiple sessions rather than trying to complete everything at once. This prevents fatigue and allows time for reflection between sessions.
Common Pitfalls
Avoid the temptation to map the ideal process instead of the current reality. Teams often want to show how they think things should work rather than acknowledging current problems. This prevents you from identifying real improvement opportunities.
Don’t get lost in excessive detail during initial mapping. Focus on major process steps and obvious waste patterns. You can always add more detail later as you dive deeper into specific improvement areas.
Resist the urge to start implementing solutions before completing your current state map. Teams often want to fix obvious problems immediately, but premature solutions can address symptoms rather than root causes.
Advanced Value Stream Mapping Techniques
Multi-Level Mapping
Create high-level value stream maps that show the overall flow from customer request to delivery, then drill down into detailed maps for specific sub-processes. This approach helps you understand both strategic and tactical improvement opportunities.
The portfolio level shows how different products or features compete for resources and move through your development pipeline. The team level focuses on specific development practices like coding, testing, and deployment. The technical level examines individual processes like code review, build automation, or database deployment.
Connect these levels by showing how improvements at one level impact others. For example, better automated testing at the technical level can reduce cycle time at the team level, which improves throughput at the portfolio level.
Dynamic Value Stream Analysis
Traditional value stream maps show a snapshot in time, but development processes change constantly. Dynamic analysis tracks how your value stream metrics evolve over time and under different conditions.
Monitor seasonal patterns in your development flow. Many teams see different patterns during product launches, holiday seasons, or budget cycles. Understanding these patterns helps you plan capacity and set realistic expectations.
Analyze how different types of work flow through your system. Bug fixes might follow different paths than new features, and emergency changes might bypass normal quality gates. Map these variations to ensure your process handles all work types effectively.
Cross-Functional Value Streams
Modern software development often involves multiple teams, vendors, or business units. Cross-functional value stream mapping reveals dependencies and handoffs that single-team maps might miss.
Include external dependencies like third-party APIs, vendor deliverables, or regulatory approvals. These external factors often create the biggest bottlenecks in your process, but they’re frequently overlooked in team-focused improvement efforts.
Map the customer experience alongside your internal development process. Show how your internal activities connect to customer-visible outcomes and experiences. This perspective helps prioritize improvements based on customer impact rather than internal convenience.
Case Studies and Real-World Examples
E-commerce Platform Optimization
A mid-sized e-commerce company struggling with slow feature delivery implemented value stream mapping across their development organization. Their initial mapping revealed that features took an average of 12 weeks from concept to production, with only 8% of that time spent actually developing functionality.
The mapping process identified several key waste areas: approval workflows that took 2-3 weeks, manual deployment processes that caused frequent delays, and a code review bottleneck where only two senior developers could approve changes. Additionally, they discovered that 40% of features required significant rework after initial development due to unclear requirements.
Their improvement plan focused on streamlining approvals, automating deployment pipelines, and implementing better requirements gathering practices. After six months of focused improvement, they reduced average delivery time to 6 weeks while improving quality metrics. Most importantly, the percentage of value-added time increased from 8% to 25%.
Financial Services Regulatory Compliance
A financial services firm needed to improve their ability to respond to regulatory changes while maintaining strict compliance requirements. Their value stream mapping revealed a complex approval process involving legal, compliance, risk management, and multiple business units.
The current state map showed that regulatory changes took 16-20 weeks to implement, with most time spent in review cycles and waiting for approvals. The team discovered that different stakeholders were reviewing the same changes multiple times, and there was no clear prioritization mechanism for competing regulatory requirements.
Their future state design included parallel review processes, standardized compliance checklists, and a centralized regulatory change board. They also implemented automated compliance testing to catch issues earlier in the development process. These changes reduced implementation time to 8-10 weeks while actually improving compliance outcomes.
Mobile App Development Transformation
A mobile app development team was struggling with long release cycles and quality issues. Their value stream mapping revealed a highly fragmented process with multiple handoffs between iOS developers, Android developers, backend teams, QA, and operations.
The mapping showed that different platforms followed different development processes, leading to inconsistent quality and timing. Features often worked on one platform but failed on others, requiring extensive rework and coordination. The team also discovered that their manual testing process was becoming a bottleneck as the app grew more complex.
Their improvement plan focused on creating cross-platform development practices, implementing automated testing across all platforms, and establishing feature teams that included both iOS and Android developers. They also introduced continuous integration practices that caught platform-specific issues much earlier in the development process.
Measuring Success and Continuous Improvement
Establishing Baseline Metrics
Before implementing improvements, establish clear baseline measurements for your key metrics. Track these consistently for at least 4-6 weeks to account for normal variation in your process. Include both quantitative metrics like cycle time and lead time, and qualitative measures like team satisfaction and customer feedback.
Document not just the average values, but also the variation and distribution of your metrics. A process with high variation often indicates systemic issues that need addressing. For example, if your cycle time averages 10 days but ranges from 2 to 30 days, you have process stability issues regardless of the average.
Create a measurement dashboard that tracks your key value stream metrics over time. Update this regularly and make it visible to the entire team. Transparency in measurement helps maintain focus on improvement efforts and celebrates progress as it occurs.
Improvement Planning and Execution
Prioritize improvements based on impact and feasibility. High-impact, low-effort improvements should be implemented first to build momentum and demonstrate value. Create a roadmap that shows how different improvements build on each other over time.
Use Plan-Do-Check-Act (PDCA) cycles for implementing improvements. Plan each change carefully with clear success criteria, implement on a small scale first, check the results against your expectations, and then act to either standardize the improvement or modify your approach.
Implement changes incrementally rather than trying to transform everything at once. Large-scale changes are difficult to manage and make it hard to identify what’s working and what isn’t. Small, frequent improvements are easier to implement and less disruptive to ongoing work.
Long-term Value Stream Evolution
Schedule regular value stream reviews to assess progress and identify new improvement opportunities. As you solve obvious problems, more subtle issues will become visible. What seemed like minor inefficiencies initially may become major bottlenecks as other constraints are removed.
Update your value stream maps as your process evolves. Don’t let your maps become outdated documentation that no longer reflects reality. Living maps that evolve with your process remain useful tools for ongoing improvement.
Expand your value stream mapping to include customer experience and business outcomes, not just internal development efficiency. As your process matures, focus shifts from basic efficiency to delivering better customer value and business results.
Integration with Agile and DevOps Practices
Scrum and Kanban Integration
Value stream mapping complements Scrum by providing visibility into the larger context beyond individual sprints. While Scrum focuses on iteration-level planning and execution, value stream mapping shows how multiple sprints and teams contribute to overall value delivery.
Use value stream insights to improve sprint planning by identifying realistic capacity constraints and potential blockers. If your value stream mapping reveals consistent testing bottlenecks, factor this into sprint planning and consider adding testing capacity or improving test automation.
Kanban boards naturally align with value stream thinking by visualizing work flow and limiting work in progress. Use your value stream map to design your Kanban board columns and policies. Each column should represent a meaningful stage in your value stream with clear entry and exit criteria.
DevOps Pipeline Optimization
Value stream mapping is essential for optimizing DevOps pipelines because it reveals the entire flow from code commit to production deployment. Traditional deployment metrics focus on individual stages, but value stream mapping shows how stages interact and where overall flow breaks down.
Map both your development pipeline (code to deployable artifact) and your release pipeline (artifact to production). Many organizations optimize one without considering the other, leading to sub-optimal overall performance.
Include monitoring and feedback loops in your value stream maps. DevOps isn’t complete when code reaches production; it includes monitoring, incident response, and continuous improvement based on production performance.
Continuous Integration and Deployment
Use value stream mapping to identify automation opportunities in your CI/CD pipeline. Manual steps often become bottlenecks as development velocity increases, and value stream mapping helps prioritize which automation efforts will have the biggest impact.
Map both successful deployments and failed deployments to understand how errors flow through your system. Often, the process for handling failures is different from the normal flow, and these exception paths can become significant sources of delay and waste.
Consider the human elements of your CI/CD pipeline, not just the technical automation. Include code review processes, approval workflows, and manual verification steps in your value stream maps. These human touchpoints often determine overall pipeline performance.
Common Challenges and Solutions
Resistance to Change
Team members may resist value stream mapping if they perceive it as criticism of their current work practices. Frame mapping as a collaborative improvement effort rather than a performance evaluation. Emphasize that the goal is understanding the system, not finding fault with individuals.
Include skeptical team members in the mapping process rather than trying to convince them beforehand. Many people become advocates once they see the insights that emerge from collaborative mapping sessions. Their skepticism can actually provide valuable perspective that prevents groupthink.
Start with voluntary participation and let success stories spread naturally. Don’t mandate value stream mapping across the entire organization immediately. Build credibility through early wins with willing teams, then expand based on demonstrated value.
Complex Multi-Team Environments
Large organizations with multiple development teams face unique challenges in value stream mapping. Work often flows between teams with different processes, tools, and cultures. Start by mapping the interfaces between teams rather than trying to map every team’s internal processes.
Focus on end-to-end customer value streams that cross team boundaries. While individual teams may be optimized, the handoffs between teams often contain the biggest improvement opportunities. Map these handoffs carefully and look for ways to reduce dependencies and improve communication.
Consider implementing program-level value stream mapping that shows how multiple teams contribute to larger business objectives. This provides context for individual team improvements and helps prioritize cross-team improvement efforts.
Maintaining Momentum
Initial enthusiasm for value stream mapping often wanes as teams get busy with daily work. Build improvement activities into regular team rhythms rather than treating them as separate projects. Include value stream review in sprint retrospectives or monthly team meetings.
Celebrate improvement wins publicly to maintain motivation and demonstrate ongoing value. Share metrics that show progress over time, and tell stories about specific problems that were solved through value stream insights.
Connect value stream improvements to individual and team goals. Help team members see how process improvements make their daily work easier and more satisfying. When people see personal benefits from improvements, they’re more likely to sustain the effort.
Future of Value Stream Mapping in Software Development
AI and Machine Learning Integration
Artificial intelligence is beginning to transform value stream mapping by automatically analyzing development data and identifying patterns that humans might miss. AI can process vast amounts of commit data, deployment logs, and issue tracking information to create dynamic value stream insights.
Machine learning algorithms can predict bottlenecks before they occur by analyzing historical patterns and current system state. This predictive capability allows teams to proactively address issues rather than reacting after problems manifest.
Natural language processing can analyze team communications, code comments, and documentation to understand informal processes and knowledge flows that traditional mapping might miss. This provides a more complete picture of how value actually flows through development organizations.
Real-Time Value Stream Analytics
Traditional value stream mapping creates static snapshots, but the future lies in real-time, dynamic visualization of value flow. Modern development tools generate continuous streams of data that can be synthesized into live value stream dashboards.
Real-time analytics enable faster feedback loops and more responsive process improvements. Instead of waiting for quarterly reviews to identify problems, teams can see issues emerging and respond immediately.
Integration with modern observability platforms means value stream mapping can include runtime performance, user experience metrics, and business outcomes alongside traditional development metrics. This holistic view connects development efficiency with business value creation.
Cross-Industry Learning
Software development continues to learn from other industries that have successfully implemented lean principles. Manufacturing, healthcare, and logistics offer proven techniques for optimizing complex processes that can be adapted to software development contexts.
The emergence of platform engineering and internal developer platforms creates new opportunities to apply value stream thinking at scale. Organizations are building internal platforms that standardize and optimize common development activities, essentially productizing their value streams.
As software becomes increasingly critical to business operations across all industries, value stream mapping skills become essential for any organization that creates digital products or services. This broader adoption drives continued innovation in tools, techniques, and best practices.
Conclusion
Value stream mapping represents a fundamental shift from optimizing individual activities to optimizing entire systems of work. In software development, where complexity and interdependencies continue to grow, this systems thinking approach becomes increasingly valuable for achieving sustainable improvements in delivery speed, quality, and customer satisfaction.
The most successful implementations of value stream mapping share common characteristics: they focus on end-to-end customer value, involve the people who actually do the work, measure results consistently, and treat improvement as an ongoing capability rather than a one-time project. Organizations that master these practices gain significant competitive advantages through faster delivery, higher quality, and better alignment between development efforts and business objectives.
As development practices continue to evolve with new technologies, methodologies, and organizational structures, the fundamental principles of value stream mapping remain relevant. The specific tools and techniques may change, but the core insight—that optimizing the whole system produces better results than optimizing individual parts—continues to drive breakthrough improvements in software development performance.
Start your value stream mapping journey with a single, important product or feature. Gather your team, map your current reality honestly, and begin the systematic work of improvement. The insights you gain will transform not just your development process, but your entire approach to creating value for customers through software.
Related Posts
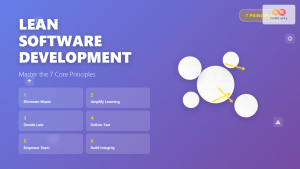
Lean Software Development: 7 Principles for Efficient Software Delivery
Lean Software Development represents a revolutionary approach to software engineering that adapts manufacturing principles from Toyota's Lean Production System to...
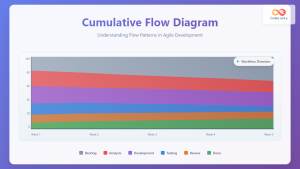
Cumulative Flow Diagram: Master Visual Flow Analysis for Agile Teams
A Cumulative Flow Diagram (CFD) serves as one of the most powerful visual tools in Agile project management, providing teams...
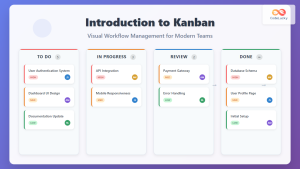
Introduction to Kanban: Visual Workflow Management for Modern Teams
In today's fast-paced business environment, teams need efficient methods to manage work, visualize progress, and optimize productivity. Kanban, a visual...
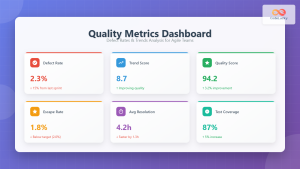
Quality Metrics: Defect Rates and Trends – Complete Guide for Agile Teams
Understanding Quality Metrics in Agile Development Quality metrics serve as the compass for Agile teams navigating the complex landscape of...

Value-Driven Development: Complete Guide to Maximizing Customer Value in Agile Projects
What is Value-Driven Development? Value-driven development is a software development approach that prioritizes delivering maximum customer value with every iteration,...
Marketing Kanban: Visual Project Management for Modern Marketing Teams
Marketing teams face unique challenges that traditional project management approaches often fail to address. Unlike software development with its predictable...
Agile Reporting: Complete Guide to Real-Time Dashboards and Performance Insights
Agile reporting transforms raw project data into actionable insights that drive successful software delivery. Unlike traditional waterfall reporting that focuses...
Build-Measure-Learn: Complete Guide to Iterative Product Development Success
The Build-Measure-Learn cycle stands as one of the most powerful frameworks in modern product development, transforming how teams approach innovation...
Agile Metrics: Complete Guide to Measuring Team Performance and Productivity
Measuring team performance in agile environments requires a strategic approach that goes beyond traditional project management metrics. Agile metrics provide...
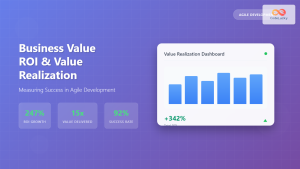
Business Value: ROI and Value Realization in Agile Development
In today's competitive business landscape, organizations investing in Agile development need more than just faster delivery—they need demonstrable business value....
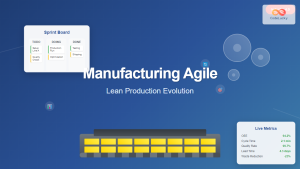
Manufacturing Agile: Lean Production Evolution and Modern Implementation Strategies
Manufacturing Agile represents a revolutionary approach that merges traditional lean production principles with modern agile methodologies, creating a powerful framework...
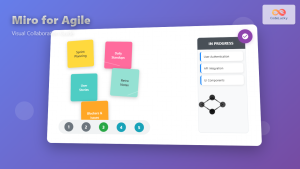
Miro for Agile: Complete Guide to Visual Collaboration and Team Productivity
Visual collaboration has become the cornerstone of successful Agile teams, especially in today's distributed work environment. Miro stands out as...