A Cumulative Flow Diagram (CFD) serves as one of the most powerful visual tools in Agile project management, providing teams with deep insights into their workflow patterns and performance metrics. This comprehensive guide explores how to leverage CFDs for optimal team productivity and continuous improvement.
What is a Cumulative Flow Diagram?
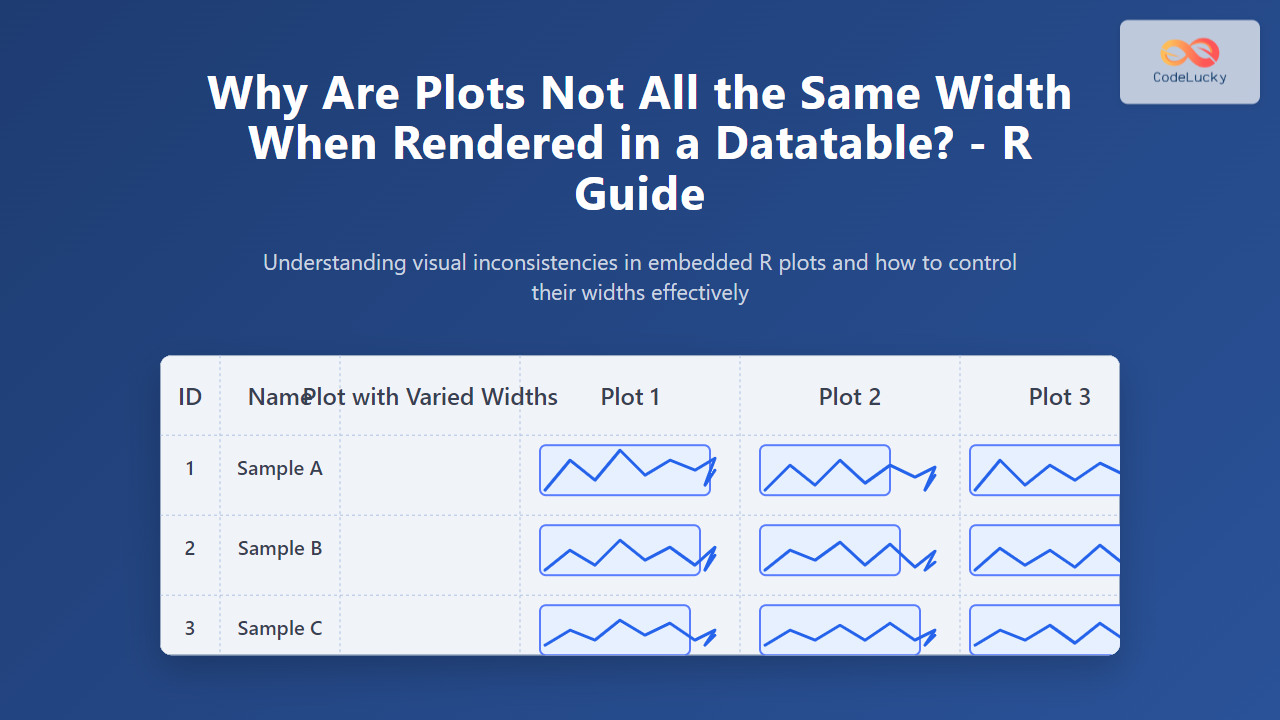
A Cumulative Flow Diagram is a stacked area chart that visualizes the flow of work items through different stages of your development process over time. Each colored band represents a specific workflow stage, such as “To Do,” “In Progress,” “Testing,” and “Done.” The vertical axis shows the cumulative count of work items, while the horizontal axis represents time.
The diagram’s power lies in its ability to reveal patterns that might not be immediately obvious when looking at individual metrics or snapshots of your board. By tracking the accumulation of work items across all stages simultaneously, teams can identify trends, bottlenecks, and opportunities for optimization.
Key Components of Cumulative Flow Diagrams
Workflow Stages
Each band in the CFD represents a distinct stage in your workflow. Common stages include:
- Backlog: Items waiting to be started
- Analysis: Requirements gathering and planning phase
- Development: Active coding and implementation
- Testing: Quality assurance and validation
- Review: Code review and stakeholder approval
- Done: Completed and delivered items
Visual Elements
The CFD uses several visual cues to communicate information:
- Band Width: Indicates the number of items in each stage
- Band Slope: Shows the rate of work completion or accumulation
- Color Coding: Differentiates between workflow stages
- Gaps or Overlaps: Reveal workflow irregularities
How to Read and Interpret CFD Patterns
Healthy Flow Patterns
A well-functioning team typically exhibits these characteristics in their CFD:
- Parallel Bands: Consistent spacing between stages indicates steady flow
- Smooth Curves: Gradual changes suggest predictable work patterns
- Proportional Widths: Balanced work distribution across stages
- Steady Slope: Consistent delivery rate over time
Problematic Patterns to Watch For
Several warning signs can indicate workflow issues:
Widening Bands
When a particular stage’s band consistently grows wider, it indicates work is accumulating in that phase faster than it’s being completed. This pattern suggests a bottleneck that requires immediate attention.
Flat Lines
Horizontal lines in any band indicate that no work is moving through that stage. This could signal blocked work, resource constraints, or process issues.
Irregular Slopes
Sudden changes in slope direction often indicate external factors affecting the team’s workflow, such as changing priorities, resource allocation shifts, or unexpected obstacles.
Benefits of Using Cumulative Flow Diagrams
Enhanced Visibility
CFDs provide stakeholders with immediate visual feedback about project progress and team performance. Unlike traditional status reports, CFDs offer real-time insights into workflow health and can highlight issues before they become critical problems.
Data-Driven Decision Making
By analyzing CFD patterns, teams can make informed decisions about resource allocation, process improvements, and capacity planning. The visual nature of the diagram makes it easier to communicate findings to both technical and non-technical stakeholders.
Continuous Improvement
Regular CFD analysis supports the Agile principle of continuous improvement by providing objective data about team performance and process effectiveness. Teams can experiment with changes and measure their impact using CFD metrics.
Creating Effective Cumulative Flow Diagrams
Data Collection Requirements
To create accurate CFDs, you need consistent data collection practices:
- Regular Updates: Ensure work items are moved between stages promptly
- Clear Definitions: Establish precise criteria for each workflow stage
- Consistent Tracking: Maintain uniform data collection methods
- Historical Data: Collect sufficient data points for meaningful analysis
Tool Selection
Most Agile project management tools offer built-in CFD functionality:
- Jira: Provides comprehensive CFD reports with customizable time ranges
- Azure DevOps: Offers detailed analytics including CFD visualization
- Trello: Basic CFD capabilities through power-ups
- Kanban Tool: Specialized CFD features for Kanban teams
Advanced CFD Analysis Techniques
Lead Time Analysis
By measuring the horizontal distance between when work enters and exits the system, teams can calculate average lead times and identify trends in delivery predictability.
Cycle Time Measurement
Similar to lead time, cycle time focuses on the active work period, excluding time spent in backlog or waiting states. This metric helps teams understand their actual processing efficiency.
Work in Progress (WIP) Optimization
CFDs make WIP limits visible and help teams understand the relationship between WIP levels and flow efficiency. Teams can experiment with different WIP limits and observe the impact on their CFD patterns.
Common Implementation Challenges
Data Quality Issues
Inconsistent or delayed updates can skew CFD accuracy. Establish clear protocols for moving work items and ensure team members understand the importance of timely updates.
Over-Analysis
While CFDs provide valuable insights, teams should avoid spending excessive time analyzing minor variations. Focus on significant patterns and trends rather than daily fluctuations.
Misinterpretation
Without proper training, team members might misread CFD patterns or draw incorrect conclusions. Invest time in educating the team about proper CFD interpretation.
Best Practices for CFD Implementation
Start Simple
Begin with basic workflow stages and gradually add complexity as the team becomes more comfortable with CFD analysis. Too many stages initially can make the diagram difficult to interpret.
Regular Review Cycles
Incorporate CFD review into regular retrospectives or standup meetings. Consistent analysis helps teams identify patterns early and make timely adjustments.
Combine with Other Metrics
Use CFDs alongside other Agile metrics like velocity, burndown charts, and team satisfaction scores for a comprehensive view of team performance.
CFD in Different Agile Frameworks
Kanban Integration
CFDs are particularly well-suited for Kanban teams, as they directly visualize the flow concept central to Kanban methodology. The continuous flow nature of Kanban makes CFD patterns especially meaningful.
Scrum Applications
Scrum teams can use CFDs to analyze sprint performance and identify recurring bottlenecks. The diagram can reveal whether work consistently accumulates in specific stages across multiple sprints.
Scaled Agile Environments
In larger organizations, CFDs can aggregate data across multiple teams or programs, providing leadership with high-level insights into organizational flow patterns.
Future Trends in CFD Analysis
Machine Learning Integration
Advanced analytics tools are beginning to incorporate machine learning algorithms to predict future CFD patterns and automatically identify anomalies or optimization opportunities.
Real-Time Notifications
Modern tools are developing capabilities to send automated alerts when CFD patterns indicate potential issues, enabling proactive problem-solving.
Enhanced Visualization
Three-dimensional CFDs and interactive visualizations are emerging to provide even richer insights into complex workflow patterns.
Measuring Success with CFDs
Success with CFDs isn’t just about creating pretty charts—it’s about driving meaningful improvements in team performance and project outcomes. Teams should focus on actionable insights that lead to process improvements, better resource allocation, and enhanced predictability.
Regular measurement of key metrics derived from CFDs, such as average lead time, cycle time consistency, and throughput stability, provides objective evidence of improvement initiatives’ effectiveness.
Conclusion
Cumulative Flow Diagrams represent a powerful tool for Agile teams seeking to understand and optimize their workflow patterns. By providing visual insights into team performance and process health, CFDs enable data-driven decision making and continuous improvement.
The key to successful CFD implementation lies in consistent data collection, regular analysis, and a commitment to acting on the insights provided. Teams that master CFD analysis gain a significant advantage in delivering value predictably and efficiently.
As Agile practices continue to evolve, CFDs will remain a fundamental tool for understanding and optimizing team performance. By incorporating CFD analysis into your regular practices, you’ll develop deeper insights into your team’s capabilities and create opportunities for sustained improvement.
Related Posts
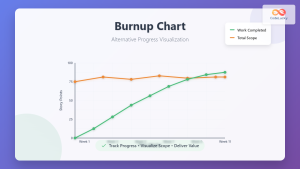
Burnup Chart: Complete Guide to Alternative Progress Visualization in Agile Projects
While burndown charts have dominated Agile project tracking for years, burnup charts offer a superior alternative for visualizing project progress...
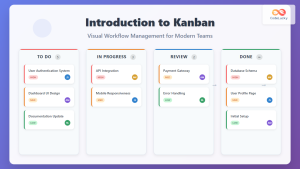
Introduction to Kanban: Visual Workflow Management for Modern Teams
In today's fast-paced business environment, teams need efficient methods to manage work, visualize progress, and optimize productivity. Kanban, a visual...
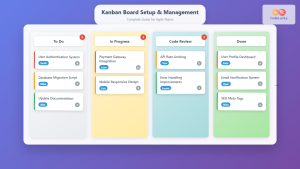
Kanban Board: Complete Setup and Management Guide for Agile Teams
Kanban boards have revolutionized how teams visualize work, manage workflows, and deliver value consistently. Originally developed by Toyota for manufacturing,...
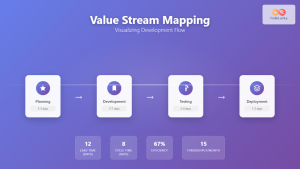
Value Stream Mapping: Complete Guide to Visualizing Development Flow for Agile Teams
What is Value Stream Mapping in Software Development? Value Stream Mapping (VSM) is a lean management technique that visualizes the...
Burndown Chart: Master Sprint Progress Tracking in Agile Development
Burndown charts are one of the most powerful visual tools in Agile project management, providing teams with real-time insights into...
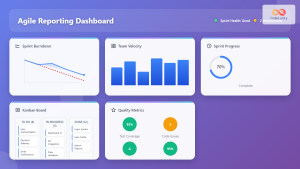
Agile Reporting: Complete Guide to Real-Time Dashboards and Performance Insights
Agile reporting transforms raw project data into actionable insights that drive successful software delivery. Unlike traditional waterfall reporting that focuses...
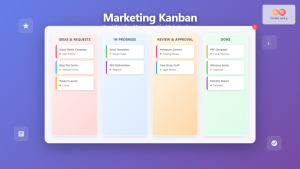
Marketing Kanban: Visual Project Management for Modern Marketing Teams
Marketing teams face unique challenges that traditional project management approaches often fail to address. Unlike software development with its predictable...

Scrumban: The Ultimate Hybrid Methodology for Agile Teams
What is Scrumban? Scrumban is a hybrid agile methodology that combines the structured framework of Scrum with the visual workflow...
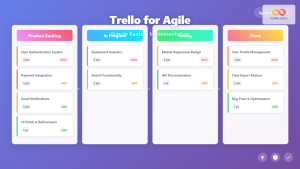
Trello for Agile: Complete Guide to Simple Kanban Implementation for Development Teams
Trello has revolutionized how development teams implement Agile methodologies, offering an intuitive visual approach to project management that makes Kanban...
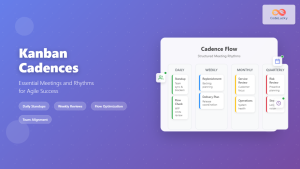
Kanban Cadences: Essential Meetings and Rhythms for Agile Success
Understanding Kanban Cadences: The Foundation of Agile Flow Kanban cadences represent the heartbeat of successful agile teams, providing structured rhythms...
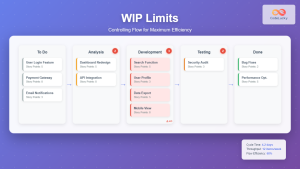
Work in Progress (WIP) Limits: Controlling Flow for Maximum Team Efficiency
Work in Progress (WIP) limits are one of the most powerful yet underutilized tools in Agile project management. By constraining...

Velocity: Team Throughput Measurement in Agile Development
Velocity stands as one of the most critical metrics in Agile development, serving as the heartbeat of team performance measurement....