Understanding the difference between lead time and cycle time is crucial for any team implementing Kanban methodology. These two fundamental metrics provide invaluable insights into your team’s performance, workflow efficiency, and customer satisfaction levels. While they’re often confused or used interchangeably, each serves a distinct purpose in measuring and optimizing your development process.
What is Lead Time in Kanban?
Lead time represents the total duration from when a customer makes a request until that request is completely fulfilled and delivered. In software development contexts, this typically means the time from when a feature request or bug report is submitted until the solution is deployed to production and available to end users.
Lead time encompasses the entire customer experience, including:
- Initial request submission and documentation
- Requirements gathering and analysis
- Prioritization and backlog placement
- Active development work
- Testing and quality assurance
- Deployment and release processes
From a business perspective, lead time directly impacts customer satisfaction and competitive advantage. Shorter lead times mean faster response to market demands, quicker problem resolution, and improved customer experience.
What is Cycle Time in Kanban?
Cycle time measures the duration from when work actually begins on an item until it’s completed and ready for delivery. This metric focuses specifically on the active work period, excluding any waiting time before development starts.
Cycle time typically includes:
- Development and implementation phases
- Code review processes
- Testing and debugging activities
- Final quality checks before completion
Cycle time provides insights into your team’s execution efficiency and helps identify bottlenecks within the active development process. It’s particularly valuable for capacity planning and estimating how long similar work items will take to complete.
Key Differences Between Lead Time and Cycle Time
The fundamental distinction lies in their starting points and what they measure:
| Aspect | Lead Time | Cycle Time |
|---|---|---|
| Starting Point | Customer request submission | Work begins (development starts) |
| Ending Point | Delivery to customer | Work item completed |
| Perspective | Customer-focused | Team-focused |
| Includes Waiting | Yes (queue time, delays) | No (active work only) |
| Primary Use | Customer satisfaction, SLA tracking | Process efficiency, capacity planning |
How to Measure Lead Time and Cycle Time
Accurate measurement requires clear definitions of start and end points for both metrics. Most Kanban tools provide built-in tracking capabilities, but you can also implement manual tracking methods.
Setting Up Lead Time Measurement
To measure lead time effectively:
- Define the request entry point: Establish where customer requests officially enter your system (help desk ticket, user story creation, etc.)
- Track request timestamps: Record the exact time when requests are submitted
- Define completion criteria: Clearly specify when work is considered “delivered” to the customer
- Account for business days: Decide whether to include weekends and holidays in your calculations
Setting Up Cycle Time Measurement
For cycle time measurement:
- Identify work start trigger: Determine when work officially begins (moving to “In Progress” column, assigning to developer, etc.)
- Define completion state: Establish when work is considered complete (passed testing, merged to main branch, etc.)
- Handle interruptions: Decide how to treat paused or blocked work items
- Consider work categories: Different types of work may require separate cycle time tracking
Using Kanban Tools for Time Tracking
Popular Kanban tools offer various features for tracking these metrics:
Jira
Jira provides comprehensive time tracking through its Control Chart and Cumulative Flow Diagram reports. You can configure custom fields to capture request dates and define workflow transitions that trigger time measurements.
Trello with Power-Ups
While basic Trello lacks built-in time tracking, power-ups like “Time Tracking” or “Plus for Trello” add sophisticated measurement capabilities for both lead and cycle times.
Azure DevOps
Azure DevOps offers robust analytics with built-in lead time and cycle time calculations through its Analytics service and customizable dashboards.
Analyzing and Interpreting the Data
Raw numbers alone don’t drive improvement. Understanding what your metrics reveal about your process is crucial for meaningful optimization.
Lead Time Analysis
When analyzing lead time data, focus on:
- Trend analysis: Are lead times improving, staying constant, or getting worse over time?
- Variability assessment: High variability often indicates unpredictable processes or external dependencies
- Percentile tracking: Use 50th, 75th, and 95th percentiles rather than averages to understand distribution
- Category comparison: Different types of work (bugs vs. features) may have different lead time patterns
Cycle Time Analysis
For cycle time evaluation, consider:
- Consistency patterns: Consistent cycle times indicate predictable development processes
- Bottleneck identification: Sudden increases may reveal process inefficiencies or resource constraints
- Team performance: Compare cycle times across different team members or time periods
- Complexity correlation: Analyze whether story point estimates correlate with actual cycle times
Common Pitfalls and How to Avoid Them
Teams often encounter several challenges when implementing these metrics:
Measurement Inconsistency
Inconsistent definitions of start and end points lead to unreliable data. Establish clear, documented criteria and ensure all team members understand and follow them consistently.
Gaming the Metrics
When teams are evaluated solely on these metrics, they may manipulate the system (splitting large items, rushing quality, etc.). Focus on continuous improvement rather than arbitrary targets.
Ignoring Context
Raw metrics without context can be misleading. Always consider external factors like team changes, tool migrations, or shifting priorities when interpreting data.
Over-Optimization
Optimizing for speed alone can compromise quality. Balance time metrics with quality indicators like defect rates and customer satisfaction scores.
Best Practices for Implementation
Successful metric implementation requires thoughtful planning and consistent execution:
Start Simple
Begin with basic tracking before adding complexity. Focus on getting accurate, consistent data for core metrics before expanding to advanced analytics.
Regular Review Cycles
Schedule regular retrospectives to review metric trends and identify improvement opportunities. Monthly or sprint-based reviews work well for most teams.
Combine with Qualitative Feedback
Supplement quantitative metrics with qualitative feedback from customers and team members to get a complete picture of performance.
Focus on Trends, Not Absolutes
Individual data points are less important than overall trends and patterns. Look for sustained improvements rather than daily fluctuations.
Using Metrics for Continuous Improvement
The ultimate goal of measuring lead time and cycle time is driving continuous improvement in your development process.
Identifying Improvement Opportunities
Use your metrics to:
- Pinpoint process bottlenecks and inefficiencies
- Validate the impact of process changes
- Set realistic expectations with stakeholders
- Guide resource allocation decisions
- Benchmark performance against industry standards
Setting Realistic Goals
When setting improvement targets:
- Base goals on historical data and trends
- Consider external constraints and dependencies
- Focus on reducing variability as much as absolute times
- Set incremental rather than dramatic improvement targets
Advanced Applications and Considerations
As your measurement maturity grows, consider these advanced applications:
Predictive Analytics
Use historical data to predict completion times for new work items, improving planning accuracy and stakeholder communication.
Service Level Agreements (SLAs)
Establish data-driven SLAs based on your actual performance metrics rather than arbitrary commitments.
Economic Impact Analysis
Calculate the business value of lead time improvements, such as faster time-to-market for new features or reduced customer churn from delayed bug fixes.
Integration with Other Agile Metrics
Lead time and cycle time work best when combined with complementary metrics:
- Throughput: How many items your team completes per time period
- Work in Progress (WIP): The number of items being actively worked on
- Flow efficiency: The ratio of active work time to total lead time
- Quality metrics: Defect rates, customer satisfaction scores, and technical debt measures
This holistic approach provides a comprehensive view of your team’s performance and helps prevent over-optimization in any single area.
Conclusion
Lead time and cycle time are foundational metrics for any team serious about improving their Kanban implementation. While lead time provides crucial insights into customer experience and overall process performance, cycle time focuses on execution efficiency and team productivity.
The key to success lies not just in measuring these metrics, but in using them thoughtfully to drive continuous improvement. Start with consistent measurement practices, analyze trends rather than individual data points, and always consider the broader context when making process changes.
Remember that metrics are tools for improvement, not goals in themselves. Focus on delivering value to your customers while using these measurements to guide your optimization efforts. With proper implementation and analysis, lead time and cycle time measurements will become invaluable assets in your agile transformation journey.
Related Posts
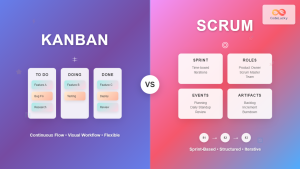
Kanban vs Scrum: Complete Guide to Choosing the Right Agile Framework
Introduction to Agile Methodologies In today's fast-paced software development landscape, choosing the right project management methodology can make or break...
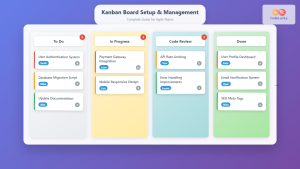
Kanban Board: Complete Setup and Management Guide for Agile Teams
Kanban boards have revolutionized how teams visualize work, manage workflows, and deliver value consistently. Originally developed by Toyota for manufacturing,...
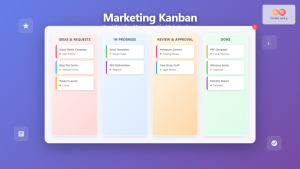
Marketing Kanban: Visual Project Management for Modern Marketing Teams
Marketing teams face unique challenges that traditional project management approaches often fail to address. Unlike software development with its predictable...
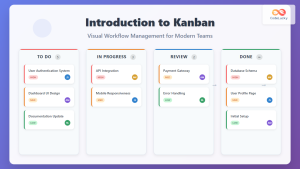
Introduction to Kanban: Visual Workflow Management for Modern Teams
In today's fast-paced business environment, teams need efficient methods to manage work, visualize progress, and optimize productivity. Kanban, a visual...
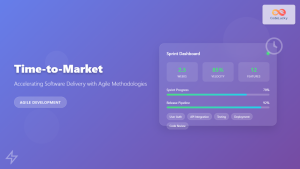
Time-to-Market: Accelerating Software Delivery with Agile Methodologies
In today's hyper-competitive software landscape, time-to-market has become the defining factor between market leaders and laggards. Organizations that can deliver...
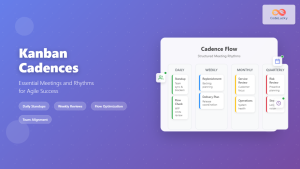
Kanban Cadences: Essential Meetings and Rhythms for Agile Success
Understanding Kanban Cadences: The Foundation of Agile Flow Kanban cadences represent the heartbeat of successful agile teams, providing structured rhythms...
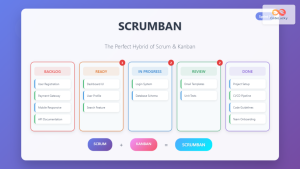
Scrumban: The Ultimate Hybrid Methodology for Agile Teams
What is Scrumban? Scrumban is a hybrid agile methodology that combines the structured framework of Scrum with the visual workflow...
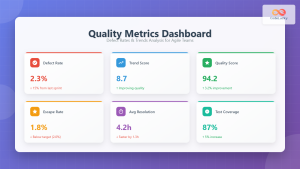
Quality Metrics: Defect Rates and Trends – Complete Guide for Agile Teams
Understanding Quality Metrics in Agile Development Quality metrics serve as the compass for Agile teams navigating the complex landscape of...
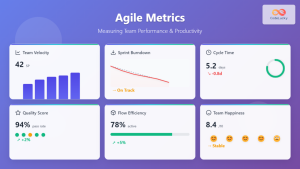
Agile Metrics: Complete Guide to Measuring Team Performance and Productivity
Measuring team performance in agile environments requires a strategic approach that goes beyond traditional project management metrics. Agile metrics provide...
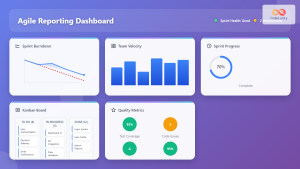
Agile Reporting: Complete Guide to Real-Time Dashboards and Performance Insights
Agile reporting transforms raw project data into actionable insights that drive successful software delivery. Unlike traditional waterfall reporting that focuses...
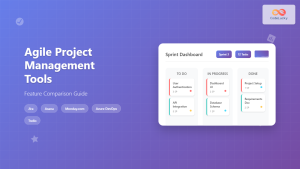
Agile Project Management Tools: Complete Feature Comparison Guide 2025
Selecting the right Agile project management tool can make or break your team's productivity and project success. With dozens of...

Story Points: Complete Guide to Agile Estimation for Development Teams
Story points represent one of the most powerful yet misunderstood concepts in Agile software development. Unlike traditional time-based estimates, story...