
The Excel MODE function is a powerful statistical tool that helps you identify the most frequently occurring value in a dataset. Whether you’re analyzing sales data, survey responses, or any numerical information, understanding how to use the MODE function effectively can provide valuable insights into your data patterns.
What is the Excel MODE Function?
The MODE function in Excel returns the most frequently occurring value in a given array or range of numbers. This statistical function is particularly useful when you need to identify the central tendency of your data, especially when dealing with discrete values that repeat multiple times.
Excel actually provides three variations of the MODE function:
- MODE.SNGL – Returns a single mode (most common value)
- MODE.MULT – Returns multiple modes if they exist
- MODE – Legacy function (equivalent to MODE.SNGL)
MODE Function Syntax
The basic syntax for the MODE function is straightforward:
=MODE(number1, [number2], ...)
Where:
- number1 – Required. The first number, cell reference, or range
- number2 – Optional. Additional numbers, cell references, or ranges (up to 255 arguments)
MODE.SNGL Syntax
=MODE.SNGL(array)
MODE.MULT Syntax
=MODE.MULT(array)
How to Use the MODE Function: Step-by-Step Examples
Basic MODE Function Example
Let’s start with a simple example. Suppose you have test scores in cells A1 through A10:
| Cell | Value |
|---|---|
| A1 | 85 |
| A2 | 92 |
| A3 | 78 |
| A4 | 85 |
| A5 | 90 |
| A6 | 85 |
| A7 | 88 |
| A8 | 92 |
| A9 | 85 |
| A10 | 90 |
To find the most frequent score, use:
=MODE(A1:A10)
This formula returns 85, as it appears four times in the dataset, more than any other value.
Using MODE.SNGL for Single Mode
The MODE.SNGL function works identically to the legacy MODE function:
=MODE.SNGL(A1:A10)
This also returns 85 in our example.
Using MODE.MULT for Multiple Modes
When your dataset has multiple values that occur with the same highest frequency, MODE.MULT can identify all of them. This function must be entered as an array formula.
Consider this dataset where both 85 and 92 appear three times each:
| Cell | Value |
|---|---|
| B1 | 85 |
| B2 | 92 |
| B3 | 78 |
| B4 | 85 |
| B5 | 90 |
| B6 | 85 |
| B7 | 88 |
| B8 | 92 |
| B9 | 92 |
| B10 | 90 |
To use MODE.MULT:
- Select a range of cells where you want the results (e.g., D1:D10)
- Type:
=MODE.MULT(B1:B10) - Press Ctrl+Shift+Enter to enter as an array formula
This will return both 85 and 92 in separate cells.
Practical Applications of the MODE Function
Sales Data Analysis
Identify the most common sales amount to understand typical transaction values:
=MODE(C2:C100)
This helps businesses understand their most frequent sale amounts and adjust pricing strategies accordingly.
Quality Control
In manufacturing, find the most common defect count per batch:
=MODE.SNGL(DefectCounts)
This information helps identify standard quality levels and detect unusual variations.
Survey Response Analysis
Determine the most common rating in customer satisfaction surveys:
=MODE(SurveyRatings)
This provides insight into typical customer sentiment.
Advanced MODE Function Techniques
Combining MODE with Other Functions
You can combine MODE with conditional functions for more sophisticated analysis:
MODE with IF Function
Find the mode of values that meet specific criteria:
=MODE(IF(Region="North",Sales))
This array formula finds the most common sales value for the North region only.
MODE with FREQUENCY Function
Create a more detailed frequency analysis:
=FREQUENCY(Data,MODE(Data))
This shows how many times the mode value appears in your dataset.
Handling Text Data
While MODE functions work only with numbers, you can analyze text data frequency using other methods:
=INDEX(TextRange,MODE(MATCH(TextRange,TextRange,0)))
This array formula finds the most frequently occurring text value.
Common Errors and Troubleshooting
#N/A Error
The #N/A error occurs when:
- No value appears more than once in the dataset
- The array contains only unique values
- All cells in the range are empty
Solution: Check your data for repeated values or use error handling:
=IFERROR(MODE(A1:A10),"No mode found")
#VALUE! Error
This error appears when:
- The range contains text values mixed with numbers
- Arguments are not properly formatted
Solution: Ensure all data is numeric or use data cleaning functions first.
#NUM! Error
Occurs when there are fewer than two data points in the array.
Solution: Verify that your range contains sufficient data points.
Best Practices for Using MODE Functions
Data Preparation
- Clean your data: Remove or handle empty cells, text values, and errors
- Check for outliers: Extreme values don’t affect MODE but may indicate data quality issues
- Standardize formats: Ensure consistent number formatting throughout your dataset
Choose the Right MODE Function
- Use MODE or MODE.SNGL for simple analysis requiring one result
- Use MODE.MULT when you need to identify all modes in multimodal distributions
- Consider the Excel version compatibility when sharing workbooks
Validation and Cross-Checking
Always validate your MODE results by:
- Creating frequency tables to verify the most common values
- Using charts to visualize data distribution
- Comparing with other statistical measures like MEDIAN and AVERAGE
MODE Function Limitations
Numerical Data Only
MODE functions work exclusively with numerical data. For text analysis, you’ll need alternative approaches using functions like COUNTIF and INDEX/MATCH combinations.
Discrete Values
MODE is most effective with discrete values that repeat exactly. For continuous data, consider grouping values into ranges first.
Sample Size Considerations
MODE results are more meaningful with larger datasets. Small samples may not provide reliable mode values.
Alternative Approaches and Related Functions
FREQUENCY Function
For detailed frequency analysis:
=FREQUENCY(DataRange,BinRange)
This provides a complete frequency distribution of your data.
COUNTIF Function
Count occurrences of specific values:
=COUNTIF(Range,Criteria)
Useful for building custom frequency analyses.
Pivot Tables
For complex frequency analysis, Pivot Tables offer a more comprehensive approach:
- Select your data range
- Insert > Pivot Table
- Drag your data field to both Rows and Values areas
- Change the value field setting to “Count”
Performance Optimization Tips
Large Datasets
For large datasets, consider:
- Using defined names instead of cell ranges for better performance
- Breaking large datasets into smaller chunks for analysis
- Implementing dynamic ranges that adjust automatically
Formula Efficiency
- Avoid volatile functions within MODE calculations
- Use absolute references when copying formulas
- Consider using tables for structured data references
Real-World Case Studies
Retail Inventory Management
A retail store uses MODE to identify the most common product sizes sold:
=MODE(SizeColumn)
This helps optimize inventory levels by stocking more of the most popular sizes.
Educational Assessment
Teachers use MODE to find the most common test scores:
=MODE.SNGL(TestScores)
This information helps identify whether the majority of students are meeting learning objectives.
Manufacturing Quality Control
Production managers track the most frequent defect types:
=MODE(DefectCodes)
This data drives targeted improvement initiatives.
Conclusion
The Excel MODE function is an essential tool for statistical analysis and data interpretation. Whether you’re using the basic MODE function, MODE.SNGL for single modes, or MODE.MULT for multiple modes, understanding these functions enables you to extract meaningful insights from your data.
Remember to always validate your results, choose the appropriate MODE function for your specific needs, and consider the limitations of your dataset. With proper application, the MODE function becomes a powerful ally in data analysis, helping you identify patterns and make informed decisions based on the most frequently occurring values in your data.
Practice with different datasets and scenarios to become proficient with these functions. The more you use MODE functions, the more intuitive they become, and the better you’ll be at extracting valuable insights from your data.
Related Posts

Excel MAX Function: Complete Guide to Finding Maximum Values in Spreadsheets
The MAX function in Microsoft Excel is one of the most fundamental and widely-used statistical functions that helps you quickly...

Excel MEDIAN Function: Complete Guide to Middle Value Calculations
The MEDIAN function in Microsoft Excel is one of the most essential statistical functions for data analysis. It calculates the...

Excel TYPE Function: Complete Guide to Data Type Detection and Validation
The Excel TYPE function is a powerful information function that identifies the data type of a value in a cell...

Excel FREQUENCY Function: Complete Guide to Frequency Distribution Analysis
The Excel FREQUENCY function is a powerful statistical tool that helps analyze data distribution by counting how many values fall...
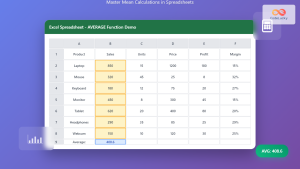
Excel AVERAGE Function: Complete Guide to Mean Calculation with Syntax Examples
The Excel AVERAGE function is one of the most fundamental and widely-used statistical functions in Microsoft Excel. This powerful function...
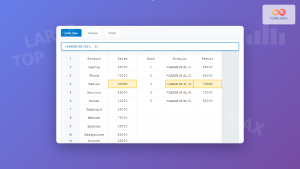
Excel LARGE Function: Find Nth Largest Value with Complete Syntax Guide
What is the Excel LARGE Function? The LARGE function in Microsoft Excel is a powerful statistical function that returns the...

Excel DAVERAGE Function: Complete Guide to Database Average Calculations
The DAVERAGE function in Microsoft Excel is a powerful database function that calculates the average of values in a database...
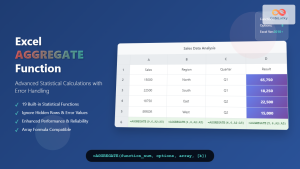
Excel AGGREGATE Function: Complete Guide to Advanced Statistical Calculations
Excel's AGGREGATE function is one of the most powerful and versatile statistical functions available in Microsoft Excel. Unlike traditional statistical...

Excel AVERAGEIFS Function: Master Multiple Criteria Calculations
The AVERAGEIFS function in Microsoft Excel is a powerful statistical tool that enables users to calculate the average of cells...

Excel COUNT Function: Complete Guide to Number Counting Formulas
The COUNT function is one of Excel's most fundamental and frequently used statistical functions. Whether you're analyzing sales data, tracking...

Excel TABLE Function: Complete Guide to Structured Data Management and Advanced Formulas
What is the Excel TABLE Function? The Excel TABLE function is a powerful feature that converts regular cell ranges into...

Excel AVERAGEIF Function: Complete Guide to Conditional Average Formulas
What is the Excel AVERAGEIF Function? The AVERAGEIF function is one of Excel's most powerful statistical tools that calculates the...


