
Excel’s AGGREGATE function is one of the most powerful and versatile statistical functions available in Microsoft Excel. Unlike traditional statistical functions, AGGREGATE provides enhanced capabilities by combining multiple statistical operations into a single function while offering sophisticated error handling and filtering options.
What is the Excel AGGREGATE Function?
The AGGREGATE function performs various statistical calculations on a dataset while providing options to ignore hidden rows, error values, and other AGGREGATE/SUBTOTAL functions within the range. This makes it particularly valuable for complex data analysis scenarios where traditional functions might fail or produce inaccurate results.
AGGREGATE was introduced in Excel 2010 and is available in all subsequent versions, including Excel 365, Excel 2019, Excel 2016, and Excel 2013.
AGGREGATE Function Syntax
The AGGREGATE function has two distinct syntax forms depending on the function number used:
Syntax Form 1 (Functions 1-11)
=AGGREGATE(function_num, options, array, [k])
Syntax Form 2 (Functions 12-19)
=AGGREGATE(function_num, options, array)
Parameters Explained
- function_num: A number from 1 to 19 that specifies which statistical function to use
- options: A number from 0 to 7 that determines which values to ignore in the calculation
- array: The range of cells or array containing the data to analyze
- k: Required for functions 1-11, specifies the k-th value (for LARGE, SMALL, PERCENTILE, QUARTILE)
Function Numbers and Their Corresponding Operations
The AGGREGATE function supports 19 different statistical operations, each identified by a specific function number:
Functions 1-11 (Require k parameter)
| Function Number | Function | Description |
|---|---|---|
| 1 | AVERAGE | Returns the average of values |
| 2 | COUNT | Counts cells containing numbers |
| 3 | COUNTA | Counts non-empty cells |
| 4 | MAX | Returns the maximum value |
| 5 | MIN | Returns the minimum value |
| 6 | PRODUCT | Returns the product of values |
| 7 | STDEV.S | Returns sample standard deviation |
| 8 | STDEV.P | Returns population standard deviation |
| 9 | SUM | Returns the sum of values |
| 10 | VAR.S | Returns sample variance |
| 11 | VAR.P | Returns population variance |
Functions 12-19 (Do not require k parameter)
| Function Number | Function | Description |
|---|---|---|
| 12 | MEDIAN | Returns the median value |
| 13 | MODE.SNGL | Returns the most frequently occurring value |
| 14 | LARGE | Returns the k-th largest value |
| 15 | SMALL | Returns the k-th smallest value |
| 16 | PERCENTILE.INC | Returns the k-th percentile (inclusive) |
| 17 | QUARTILE.INC | Returns the k-th quartile (inclusive) |
| 18 | PERCENTILE.EXC | Returns the k-th percentile (exclusive) |
| 19 | QUARTILE.EXC | Returns the k-th quartile (exclusive) |
Options Parameter Values
The options parameter controls which types of values the AGGREGATE function should ignore during calculation:
| Option | Ignores |
|---|---|
| 0 | Nothing (default behavior) |
| 1 | Hidden rows |
| 2 | Error values |
| 3 | Hidden rows and error values |
| 4 | Nothing |
| 5 | Hidden rows |
| 6 | Error values |
| 7 | Hidden rows and error values |
Note: Options 4-7 also ignore nested AGGREGATE and SUBTOTAL functions, while options 0-3 include them in calculations.
Practical Examples of AGGREGATE Function
Example 1: Basic SUM with Error Handling
=AGGREGATE(9, 6, A1:A10)
This formula sums values in range A1:A10 while ignoring any error values (#DIV/0!, #N/A, etc.).
Example 2: Average Excluding Hidden Rows
=AGGREGATE(1, 5, B1:B20)
Calculates the average of values in B1:B20, excluding hidden rows from the calculation.
Example 3: Finding the 3rd Largest Value
=AGGREGATE(14, 6, C1:C50, 3)
Returns the 3rd largest value from range C1:C50, ignoring error values.
Example 4: Median with Comprehensive Filtering
=AGGREGATE(12, 7, D1:D100)
Calculates the median while ignoring hidden rows, error values, and nested AGGREGATE/SUBTOTAL functions.
Advanced AGGREGATE Techniques
Using Arrays with AGGREGATE
AGGREGATE can work with array formulas for more complex calculations:
=AGGREGATE(9, 6, (A1:A10>5)*(A1:A10))
This formula sums only values greater than 5 from the range A1:A10.
Combining Multiple Conditions
=AGGREGATE(1, 6, IF((A1:A10>=10)*(B1:B10="Yes"), A1:A10))
Calculates average of values in A1:A10 where the value is ≥10 and corresponding B cell contains “Yes”.
Dynamic Range References
=AGGREGATE(4, 6, OFFSET(A1, 0, 0, COUNTA(A:A), 1))
Finds the maximum value in a dynamic range that expands based on data presence.
Common Errors and Troubleshooting
#VALUE! Error
Occurs when:
- Invalid function_num (not between 1-19)
- Invalid options value (not between 0-7)
- Missing k parameter for functions 14-19
#NUM! Error
Happens when:
- k parameter is invalid for the specified function
- Array contains no numeric values for statistical functions
#DIV/0! Error
Results from:
- Attempting to calculate standard deviation or variance with insufficient data points
AGGREGATE vs Traditional Functions
Advantages of AGGREGATE
- Error Resilience: Built-in error handling eliminates #DIV/0!, #N/A, and other errors
- Filtering Capabilities: Can ignore hidden rows and nested functions
- Consolidation: Single function replaces multiple traditional functions
- Performance: Often faster than array formulas for complex calculations
When to Use Traditional Functions
- Simple calculations without error handling needs
- Compatibility with older Excel versions (pre-2010)
- When specific function behavior is required
Best Practices for Using AGGREGATE
1. Choose Appropriate Options
Select option values based on your data structure:
- Use options 1, 3, 5, or 7 when working with filtered data
- Use options 2, 3, 6, or 7 when your data contains errors
- Use options 4-7 to avoid double-counting in nested calculations
2. Optimize Performance
- Limit range sizes when possible
- Use structured references with Excel tables
- Avoid volatile functions within AGGREGATE arrays
3. Documentation and Maintenance
- Comment complex AGGREGATE formulas
- Use named ranges for better readability
- Test thoroughly with edge cases
Real-World Applications
Financial Analysis
Calculate portfolio statistics while handling missing data:
=AGGREGATE(7, 6, StockReturns)
Computes standard deviation of stock returns, ignoring error values from missing data.
Sales Reporting
Generate summary statistics from filtered sales data:
=AGGREGATE(9, 5, SalesAmount)
Sums visible sales amounts, excluding hidden rows from filters.
Quality Control
Analyze measurement data with outlier handling:
=AGGREGATE(12, 6, Measurements)
Calculates median measurement, ignoring error values from faulty readings.
Compatibility and Limitations
Version Compatibility
- Excel 2010 and later versions
- Excel for Mac 2011 and later
- Excel Online (Office 365)
- Not available in Excel 2007 and earlier
Limitations
- Maximum of 255 arguments in array ranges
- Cannot reference entire columns in some versions
- Performance may degrade with very large datasets
Conclusion
The Excel AGGREGATE function represents a significant advancement in spreadsheet statistical analysis, offering robust error handling, flexible filtering options, and consolidated functionality. By mastering its syntax and understanding its various applications, you can create more reliable and efficient Excel solutions for complex data analysis tasks.
Whether you’re performing financial analysis, generating reports, or conducting statistical research, AGGREGATE provides the tools necessary to handle real-world data challenges while maintaining accuracy and performance. Its ability to ignore errors and hidden values makes it indispensable for professional Excel users working with dynamic and potentially problematic datasets.
Related Posts
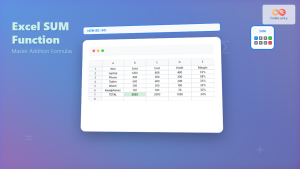
Excel SUM Function: Complete Guide to Addition Formulas and Advanced Techniques
The Excel SUM function is one of the most fundamental and widely-used formulas in Microsoft Excel, designed to add numerical...
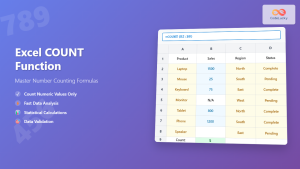
Excel COUNT Function: Complete Guide to Number Counting Formulas
The COUNT function is one of Excel's most fundamental and frequently used statistical functions. Whether you're analyzing sales data, tracking...
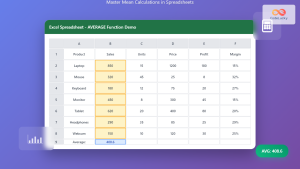
Excel AVERAGE Function: Complete Guide to Mean Calculation with Syntax Examples
The Excel AVERAGE function is one of the most fundamental and widely-used statistical functions in Microsoft Excel. This powerful function...

Excel SUBTOTAL Function: Complete Guide to Filtered Data Calculations
The Excel SUBTOTAL function is one of the most powerful yet underutilized functions in Microsoft Excel. Unlike standard aggregation functions...
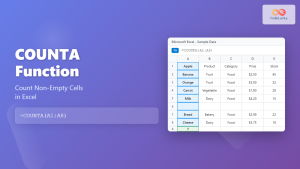
Excel COUNTA Function: Complete Guide to Non-Empty Cell Counting
The COUNTA function is one of Excel's most versatile statistical functions, designed specifically to count non-empty cells within a specified...

Excel TABLE Function: Complete Guide to Structured Data Management and Advanced Formulas
What is the Excel TABLE Function? The Excel TABLE function is a powerful feature that converts regular cell ranges into...

Excel SUMIF Function: Complete Guide to Conditional Sum Formulas with Syntax Examples
What is the Excel SUMIF Function? The SUMIF function is one of Excel's most powerful conditional sum formulas that allows...
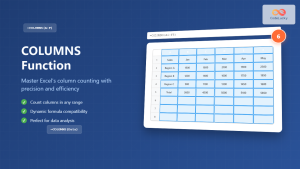
Excel COLUMNS Function: Master Column Counting with Practical Examples
The Excel COLUMNS function is a powerful built-in tool that counts the number of columns in a specified range or...
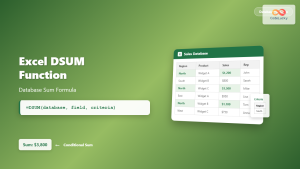
Excel DSUM Function: Complete Database Sum Formula Guide with Examples
The DSUM function in Microsoft Excel is a powerful database function that calculates the sum of values in a database...

Excel SUMPRODUCT Function: Complete Guide to Array Multiplication and Advanced Calculations
What is the Excel SUMPRODUCT Function? The SUMPRODUCT function is one of Excel's most powerful and versatile array functions that...

Excel COUNTIF Function: Master Conditional Counting with Advanced Formulas
The Excel COUNTIF function is one of the most powerful and frequently used conditional functions in Microsoft Excel. It allows...

Excel SUMIFS Function: Complete Guide to Multiple Criteria Sum Calculations
The SUMIFS function in Microsoft Excel is one of the most powerful tools for performing conditional sum calculations. Unlike the...


