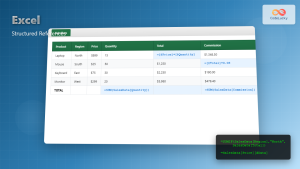
What is the Excel TABLE Function?
The Excel TABLE function is a powerful feature that converts regular cell ranges into structured, dynamic data tables with enhanced functionality. Unlike traditional cell ranges, Excel tables provide automatic formatting, built-in filtering, dynamic expansion, and structured references that make data management significantly more efficient.
When you convert a range to a table, Excel automatically applies consistent formatting, adds filter buttons to headers, and enables features like automatic formula copying and dynamic range expansion. This transformation creates a more organized, professional, and functional dataset that responds intelligently to data changes.
TABLE Function Syntax and Structure
The TABLE function in Excel follows a straightforward syntax pattern:
=TABLE(array, [column_index_num], [range_lookup])However, the more common approach is creating tables through Excel’s interface rather than using a direct TABLE formula. The structured table creation involves:
- Data Range Selection: Selecting the range containing your data including headers
- Table Creation: Using Insert > Table or Ctrl+T keyboard shortcut
- Configuration: Confirming data range and header row settings
- Customization: Applying table styles and configuring options
Creating Excel Tables: Step-by-Step Process
Method 1: Using the Insert Tab
The most straightforward method for creating Excel tables involves using the ribbon interface:
- Select your data range including column headers
- Navigate to the Insert tab in the Excel ribbon
- Click the Table button in the Tables group
- Verify the data range in the Create Table dialog box
- Ensure “My table has headers” is checked if applicable
- Click OK to create the table
Method 2: Keyboard Shortcut Method
For faster table creation, Excel provides a convenient keyboard shortcut:
- Select any cell within your data range
- Press Ctrl+T or Ctrl+L
- Excel automatically detects the data range boundaries
- Confirm the range and header settings
- Press Enter to create the table
Structured References in Excel Tables
One of the most powerful features of Excel tables is structured references, which replace traditional cell references with meaningful column and table names. This system makes formulas more readable and maintainable.
Basic Structured Reference Syntax
Structured references follow this pattern:
TableName[ColumnName]For example, if you have a table named “SalesData” with a column “Revenue”, you would reference it as:
=SUM(SalesData[Revenue])Advanced Structured Reference Patterns
Excel tables support various structured reference patterns for different scenarios:
- Entire Column:
Table1[Column1] - Current Row:
Table1[@Column1] - Header Row:
Table1[#Headers] - Data Body:
Table1[#Data] - Totals Row:
Table1[#Totals] - Entire Table:
Table1[#All] - This Row:
Table1[@]
Dynamic Table Features and Functionality
Automatic Expansion
Excel tables automatically expand when you add new data adjacent to the existing table structure. This dynamic behavior ensures that formulas, formatting, and references automatically include new data without manual updates.
When you type data in the row immediately below a table or the column immediately to the right, Excel recognizes the pattern and extends the table boundaries. This feature eliminates the need to manually adjust ranges in formulas and charts.
Formula Auto-Completion
Tables provide intelligent formula suggestions and auto-completion for structured references. When you start typing a formula that references table data, Excel displays available table and column names, making formula creation faster and more accurate.
Consistent Formatting
Excel tables maintain consistent formatting across all rows and columns. When you add new data, the table automatically applies the established formatting pattern, ensuring visual consistency without manual intervention.
Table Formatting and Styling Options
Built-in Table Styles
Excel provides numerous pre-designed table styles accessible through the Table Design tab. These styles include various color schemes, banding patterns, and header formatting options that enhance data readability and professional appearance.
Custom Table Formatting
Beyond built-in styles, you can create custom table formats by:
- Modifying individual cell formatting within the table
- Creating custom conditional formatting rules
- Adjusting row banding and column highlighting
- Customizing header and total row appearances
Advanced TABLE Function Techniques
Calculated Columns
Excel tables support calculated columns that automatically apply formulas to entire columns. When you create a formula in one cell of a table column, Excel automatically copies the formula to all other cells in that column, maintaining consistency and reducing errors.
Example of a calculated column formula:
=[@Price] * [@Quantity]This formula multiplies the Price and Quantity values for each row, automatically updating when data changes.
Total Rows and Summary Functions
Tables can include total rows that provide summary calculations for each column. The total row supports various functions including:
- SUM for numerical totals
- AVERAGE for mean calculations
- COUNT for counting non-empty cells
- MAX and MIN for extreme values
- Custom formulas for specialized calculations
Table Relationships and Data Validation
Excel tables integrate seamlessly with data validation rules and can participate in table relationships for more complex data modeling scenarios. This functionality supports creating interconnected datasets with enforced data integrity.
TABLE Function in Formulas and Functions
Using Tables with VLOOKUP and XLOOKUP
Tables significantly improve lookup functions by providing structured references instead of fixed ranges:
=VLOOKUP(A2, ProductTable, 2, FALSE)This approach ensures that lookup ranges automatically adjust when table data changes, eliminating common errors associated with fixed range references.
Integration with PivotTables
Excel tables serve as ideal data sources for PivotTables because they automatically update PivotTable source ranges when table data expands. This integration ensures that PivotTable analyses remain current without manual range adjustments.
Chart Data Sources
When you use tables as chart data sources, the charts automatically update to include new data added to the table. This dynamic relationship maintains chart accuracy and eliminates the need for manual data range updates.
Troubleshooting Common TABLE Function Issues
Table Name Conflicts
Excel requires unique table names within each workbook. If you encounter naming conflicts, use the Table Design tab to rename tables with descriptive, unique identifiers that reflect their content and purpose.
Structured Reference Errors
Common structured reference errors include:
- Misspelled table or column names
- References to deleted columns
- Incorrect syntax in structured formulas
- Circular reference issues in calculated columns
Performance Considerations
Large tables with numerous calculated columns can impact Excel performance. Optimize table performance by:
- Limiting unnecessary calculated columns
- Using efficient formulas in table calculations
- Avoiding volatile functions in table formulas
- Converting tables to ranges when dynamic features aren’t needed
Best Practices for Excel TABLE Function
Naming Conventions
Establish consistent naming conventions for tables and columns:
- Use descriptive names that reflect data content
- Avoid spaces and special characters in names
- Follow organizational naming standards
- Keep names concise but meaningful
Data Organization Principles
Structure your data effectively before converting to tables:
- Ensure each column represents a single data type
- Use consistent data formats within columns
- Include comprehensive header rows
- Eliminate blank rows and columns within data ranges
Maintenance and Updates
Maintain table integrity through regular reviews:
- Verify formula accuracy in calculated columns
- Check data validation rules and constraints
- Update table formatting and styles as needed
- Monitor table performance with large datasets
Real-World TABLE Function Examples
Sales Data Management
Consider a sales tracking table with columns for Date, Salesperson, Product, Quantity, and Price. Using structured references, you can create calculated columns for total sales:
=[@Quantity] * [@Price]Summary formulas can calculate totals by salesperson:
=SUMIF(SalesTable[Salesperson], "John Smith", SalesTable[Total])Inventory Management
An inventory table might include Product ID, Product Name, Current Stock, Reorder Level, and Supplier. Calculated columns can identify items needing reorder:
=IF([@Current Stock] <= [@Reorder Level], "Reorder Required", "Sufficient Stock")Financial Analysis
Financial data tables benefit from structured references in ratio calculations and variance analysis:
=[@Actual] / [@Budget] - 1This formula calculates budget variance percentages automatically for each row in the financial table.
Integration with Other Excel Features
Power Query and Tables
Excel tables integrate seamlessly with Power Query for advanced data transformation and importation. Tables serve as both source and destination for Power Query operations, enabling sophisticated data processing workflows.
Power Pivot Relationships
In Power Pivot data models, Excel tables can participate in relationships with other tables, enabling complex analytical scenarios and advanced calculations across multiple data sources.
Macros and VBA Integration
Excel tables are accessible through VBA programming, allowing automated table manipulation, data processing, and report generation. The ListObject model in VBA provides comprehensive table control capabilities.
Performance Optimization for Large Tables
Memory Management
Large Excel tables require careful memory management:
- Monitor system resources when working with extensive datasets
- Consider breaking large tables into smaller, related tables
- Use external data connections for very large datasets
- Implement data archiving strategies for historical information
Calculation Optimization
Optimize table calculations through:
- Efficient formula design in calculated columns
- Appropriate use of array formulas
- Strategic placement of volatile functions
- Regular cleanup of unused calculated columns
Future-Proofing Your Excel Tables
Scalability Considerations
Design tables with future growth in mind:
- Plan for data expansion in both rows and columns
- Design flexible formula structures
- Document table purposes and relationships
- Establish maintenance procedures and schedules
Compatibility and Sharing
Ensure table compatibility across different Excel versions and platforms:
- Test tables in various Excel environments
- Document version-specific features used
- Provide alternative solutions for older Excel versions
- Consider cloud-based collaboration requirements
The Excel TABLE function represents a fundamental shift from basic spreadsheet functionality to structured data management. By implementing tables effectively, you transform static data ranges into dynamic, intelligent datasets that respond to changes, maintain consistency, and provide powerful analytical capabilities. Whether managing simple lists or complex business data, Excel tables offer the tools and flexibility needed for professional data management and analysis.
Related Posts
Excel Structured References: Complete Table Formula Syntax Guide
Excel structured references revolutionize how you work with tables by replacing traditional cell references with intuitive, readable formula syntax. Instead...
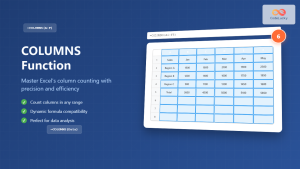
Excel COLUMNS Function: Master Column Counting with Practical Examples
The Excel COLUMNS function is a powerful built-in tool that counts the number of columns in a specified range or...
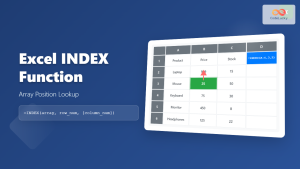
Excel INDEX Function: Complete Guide to Array Position Lookup with Practical Examples
The Excel INDEX function is one of the most powerful and versatile lookup functions available in Microsoft Excel. Unlike other...

Excel OFFSET Function: Dynamic Reference Formula for Advanced Data Management
The Excel OFFSET function is one of the most powerful yet underutilized tools for creating dynamic references in spreadsheets. This...
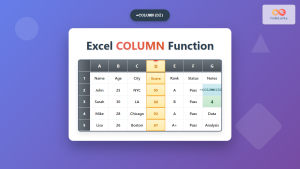
Excel COLUMN Function: Complete Guide to Column Number References
The Excel COLUMN function is a fundamental lookup and reference function that returns the column number of a specified cell...
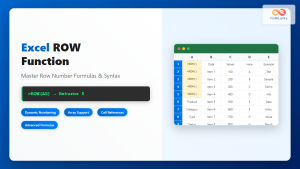
Excel ROW Function: Complete Guide to Row Number Formula and Syntax
The Excel ROW function is one of the most fundamental yet powerful functions in Microsoft Excel, designed to return the...
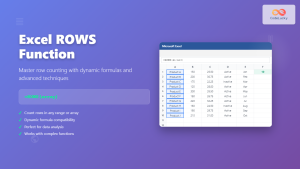
Excel ROWS Function: Complete Guide to Count Rows with Formula Syntax Examples
What is the Excel ROWS Function? The ROWS function in Microsoft Excel is a built-in lookup and reference function that...
Excel TRANSPOSE Function: Complete Guide to Array Transposition with Examples
The TRANSPOSE function in Microsoft Excel is a powerful array function that allows you to convert rows to columns and...
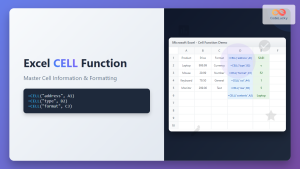
Excel CELL Function: Complete Guide to Cell Information Formula Syntax
The CELL function in Microsoft Excel is a powerful information function that returns specific details about the formatting, location, or...

Excel XLOOKUP Function: Complete Guide to Modern Lookup Formulas
Excel's XLOOKUP function represents a revolutionary advancement in spreadsheet lookup capabilities, offering a modern alternative to traditional VLOOKUP and HLOOKUP...
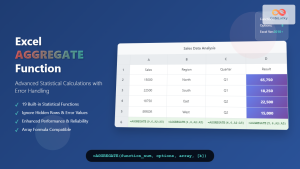
Excel AGGREGATE Function: Complete Guide to Advanced Statistical Calculations
Excel's AGGREGATE function is one of the most powerful and versatile statistical functions available in Microsoft Excel. Unlike traditional statistical...

Excel CHOOSE Function: Dynamic Value Selection Made Simple
The Excel CHOOSE function is a powerful lookup and reference function that allows you to select and return a specific...