
What is the Excel LARGE Function?
The LARGE function in Microsoft Excel is a powerful statistical function that returns the nth largest value from a dataset or array. Whether you’re analyzing sales figures, test scores, or any numerical data, the LARGE function helps you quickly identify the highest values without manually sorting your entire dataset.
This function is particularly valuable for data analysis, reporting, and creating dynamic dashboards where you need to highlight top performers or identify outliers in your data.
Excel LARGE Function Syntax
The syntax for the LARGE function is straightforward and consists of two required arguments:
Function Arguments Explained
- array (required): The range of cells or array of values from which you want to find the largest value
- k (required): The position (rank) of the largest value you want to return, where 1 represents the largest value, 2 the second largest, and so on
How the LARGE Function Works
The LARGE function operates by internally sorting your data in descending order and then returning the value at the specified position. Here’s how it processes different scenarios:
Basic Operation Process
- Excel examines all numerical values in the specified array
- Ignores text values, blank cells, and logical values
- Sorts the numerical values in descending order
- Returns the value at the kth position
Practical Examples of LARGE Function
Example 1: Finding Top Sales Performance
Imagine you have monthly sales data in cells A1:A10 with values: 15000, 22000, 18000, 25000, 12000, 30000, 19000, 21000, 16000, 28000.
Formula: =LARGE(A1:A10, 1)
Result: 30000 (highest sales figure)
Formula: =LARGE(A1:A10, 3)
Result: 25000 (third highest sales figure)
Example 2: Dynamic Top N Analysis
You can make the LARGE function dynamic by referencing a cell for the k value:
Formula: =LARGE(A1:A10, B1)
Where B1 contains the rank number you want to find.
Example 3: Handling Duplicate Values
When your dataset contains duplicate values, the LARGE function treats each instance separately:
Data: 100, 95, 95, 90, 85
Formula: =LARGE(A1:A5, 2)
Result: 95 (second occurrence of the highest unique value)
Advanced LARGE Function Techniques
Creating Top N Lists
Combine LARGE with other functions to create dynamic top performer lists:
Array Formula: =LARGE($A$1:$A$10, {1;2;3;4;5})
This returns the top 5 largest values in a single formula.
Conditional LARGE with IF Function
Use LARGE with conditional logic to find largest values meeting specific criteria:
Formula: =LARGE(IF(B1:B10="North", A1:A10), 1)
Finds the largest value in column A where column B equals “North” (requires Ctrl+Shift+Enter for array entry).
Common Errors and Troubleshooting
#NUM! Error
This error occurs when:
- The k value is greater than the number of values in the array
- The k value is less than or equal to zero
- The array contains no numerical values
#VALUE! Error
This error appears when:
- Non-numerical values are used for the k argument
- The array argument is invalid
Best Practices for Error Prevention
- Always ensure your k value is between 1 and the count of numerical values
- Use the COUNT function to verify the number of numerical values in your range
- Include error handling with IFERROR function for robust formulas
LARGE vs Other Excel Functions
LARGE vs MAX Function
While MAX only returns the highest value, LARGE offers flexibility to find any nth largest value, making it more versatile for detailed analysis.
LARGE vs SMALL Function
The SMALL function works oppositely to LARGE, finding the nth smallest value instead of the largest. Use SMALL(array, 1) to find the minimum value.
LARGE vs RANK Function
RANK tells you the position of a specific value, while LARGE tells you the value at a specific position.
Practical Applications in Business
Sales Analysis
Identify top-performing sales representatives, products, or territories by using LARGE to extract the highest revenue figures from your sales data.
Performance Metrics
In educational settings, use LARGE to find the top test scores, helping identify high achievers or set performance benchmarks.
Financial Analysis
Analyze investment returns, profit margins, or expense categories by identifying the largest values in your financial datasets.
Performance Optimization Tips
Efficient Range Selection
Use specific cell ranges rather than entire columns to improve calculation speed, especially in large spreadsheets.
Array Formula Alternatives
For multiple LARGE calculations, consider using helper columns instead of complex array formulas to maintain spreadsheet performance.
Dynamic Ranges with Named Ranges
Create named ranges for your data arrays to make formulas more readable and easier to maintain.
Integration with Other Excel Features
Conditional Formatting
Combine LARGE with conditional formatting rules to automatically highlight top values in your datasets.
Charts and Visualization
Use LARGE function results as data sources for charts that focus on top performers or highest values.
PivotTable Integration
While PivotTables offer built-in ranking features, the LARGE function provides more granular control for custom analyses.
Conclusion
The Excel LARGE function is an essential tool for anyone working with numerical data analysis. Its simple yet powerful syntax makes it easy to identify top performers, outliers, and significant values in any dataset. By mastering the LARGE function along with its advanced applications and troubleshooting techniques, you’ll enhance your Excel proficiency and data analysis capabilities.
Whether you’re creating executive dashboards, analyzing sales performance, or conducting statistical analysis, the LARGE function provides the flexibility and reliability needed for professional-grade Excel solutions. Practice with different datasets and explore combinations with other Excel functions to unlock the full potential of this valuable statistical tool.
Related Posts
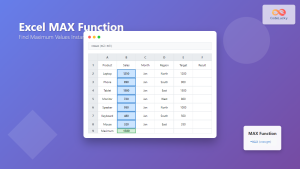
Excel MAX Function: Complete Guide to Finding Maximum Values in Spreadsheets
The MAX function in Microsoft Excel is one of the most fundamental and widely-used statistical functions that helps you quickly...

Excel SMALL Function: Find Nth Smallest Value with Easy Formula Examples
The Excel SMALL function is one of the most powerful statistical functions for finding the nth smallest value in a...
Excel RANK Function: Complete Guide to Value Ranking with Syntax Examples
What is the Excel RANK Function? The Excel RANK function is a powerful statistical tool that determines the rank of...
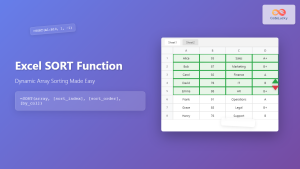
Excel SORT Function: Complete Guide to Dynamic Array Sorting Formula
The Excel SORT function is a powerful dynamic array formula introduced in Excel 365 that allows you to sort data...
MySQL MAX Function: Finding Maximum Values
The MySQL MAX() function is a powerful tool for identifying the highest value within a dataset. Whether you're tracking sales...
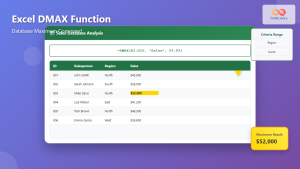
Excel DMAX Function: Complete Database Maximum Command Reference
The Excel DMAX function is a powerful database function that returns the maximum value from a field in a database...
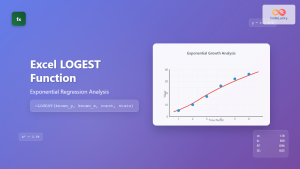
Excel LOGEST Function: Complete Guide to Exponential Regression Analysis
What is the Excel LOGEST Function? The LOGEST function in Microsoft Excel is a powerful statistical tool that performs exponential...

Excel LOOKUP Function: Complete Guide to Basic Search Commands and Advanced Techniques
The LOOKUP function in Microsoft Excel is a powerful search tool that allows you to find specific values within your...

Excel MEDIAN Function: Complete Guide to Middle Value Calculations
The MEDIAN function in Microsoft Excel is one of the most essential statistical functions for data analysis. It calculates the...

SQL MAX() Function: Retrieving the Largest Value
SQL's MAX() function is a powerful tool in a database developer's arsenal, allowing you to quickly find the highest value...
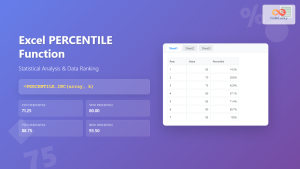
Excel PERCENTILE Function: Complete Guide to Statistical Analysis and Ranking
The Excel PERCENTILE function is a powerful statistical tool that helps you analyze data distribution and identify specific values within...
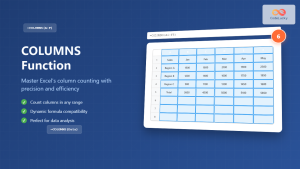
Excel COLUMNS Function: Master Column Counting with Practical Examples
The Excel COLUMNS function is a powerful built-in tool that counts the number of columns in a specified range or...


