In today’s competitive software landscape, customer satisfaction serves as the ultimate measure of Agile team success. While traditional metrics focus on internal processes, value delivery metrics bridge the gap between development efforts and real customer outcomes. This comprehensive guide explores the essential metrics that truly matter for measuring customer satisfaction and value delivery in Agile environments.
Understanding Customer Satisfaction in Agile Context
Customer satisfaction in Agile goes beyond simple surveys or feedback forms. It encompasses the entire customer journey, from initial product discovery to ongoing usage and advocacy. Agile teams must understand that value delivery is not just about shipping features—it’s about solving real customer problems and creating meaningful experiences.
The Agile Manifesto emphasizes customer collaboration over contract negotiation, making customer satisfaction a fundamental principle. However, measuring this satisfaction requires a structured approach that combines quantitative data with qualitative insights.
Core Customer Satisfaction Metrics
Net Promoter Score (NPS)
Net Promoter Score remains one of the most valuable metrics for measuring customer loyalty and satisfaction. NPS asks customers a simple question: “How likely are you to recommend our product to a friend or colleague?” on a scale of 0-10.
The calculation involves categorizing responses into three groups:
- Promoters (9-10): Loyal customers who drive growth through referrals
- Passives (7-8): Satisfied but unenthusiastic customers
- Detractors (0-6): Unhappy customers who may damage brand reputation
NPS = % Promoters – % Detractors
For Agile teams, tracking NPS after each major release or sprint can provide immediate feedback on customer perception changes. A declining NPS may indicate that recent features aren’t meeting customer expectations, while improving scores suggest successful value delivery.
Customer Satisfaction Score (CSAT)
Customer Satisfaction Score measures immediate satisfaction with specific interactions, features, or experiences. Unlike NPS, which focuses on overall loyalty, CSAT captures point-in-time satisfaction levels.
CSAT typically uses a 1-5 scale asking: “How satisfied were you with [specific experience]?” The score is calculated as the percentage of satisfied customers (those rating 4 or 5) out of total responses.
Agile teams can leverage CSAT for:
- Feature-specific feedback after releases
- User interface satisfaction measurements
- Support interaction quality assessment
- Onboarding experience evaluation
Customer Effort Score (CES)
Customer Effort Score measures how easy it is for customers to accomplish their goals with your product. This metric strongly correlates with customer loyalty, as customers prefer solutions that require minimal effort.
CES typically asks: “How easy was it to [complete specific task]?” on a scale of 1-7, where 1 is “very difficult” and 7 is “very easy.”
For Agile teams, CES is particularly valuable because it directly relates to user experience design and workflow optimization—core areas where Agile methodologies excel.
Value Delivery Metrics That Matter
Feature Adoption Rate
Feature adoption rate measures the percentage of users who actively use new features within a specific timeframe after release. This metric directly correlates with value delivery success.
Feature Adoption Rate = (Number of users using the feature / Total number of active users) × 100
Low adoption rates may indicate:
- Poor feature discoverability
- Insufficient user education
- Misalignment with customer needs
- Complex user interface design
Agile teams should track adoption rates across different timeframes (7-day, 30-day, 90-day) to understand both immediate uptake and long-term value perception.
Time to Value (TTV)
Time to Value measures how quickly customers realize value from your product. This metric is crucial for customer satisfaction because faster value realization leads to higher satisfaction and reduced churn.
TTV can be measured in various ways:
- Time to First Value: How long until customers experience initial benefit
- Time to Proficiency: How long until customers become competent users
- Time to ROI: How long until customers see return on investment
Agile teams can optimize TTV by focusing on user onboarding, feature simplicity, and progressive disclosure of advanced functionality.
Customer Lifetime Value (CLV)
Customer Lifetime Value represents the total revenue expected from a customer throughout their relationship with your product. While not a direct satisfaction metric, CLV strongly correlates with customer satisfaction and successful value delivery.
CLV = (Average Purchase Value × Purchase Frequency × Customer Lifespan)
Rising CLV indicates successful value delivery, while declining CLV may signal satisfaction issues or competitive threats.
Behavioral Metrics for Value Assessment
Daily/Monthly Active Users (DAU/MAU)
Active user metrics provide insights into product stickiness and ongoing value delivery. Consistent or growing active user counts indicate successful value creation.
The DAU/MAU ratio is particularly valuable, as it shows user engagement depth:
- High ratio (>20%): Indicates strong daily engagement and value
- Medium ratio (10-20%): Suggests moderate engagement
- Low ratio (<10%): May indicate limited value perception
Feature Usage Depth
Feature usage depth measures how extensively customers use product features. This metric helps identify which features deliver the most value and which may need improvement or retirement.
Track metrics such as:
- Average features used per session
- Advanced feature adoption rates
- Feature usage progression over time
- Feature abandonment rates
Session Duration and Frequency
Session metrics reveal customer engagement patterns and value perception. Longer sessions may indicate high value and engagement, while frequent short sessions might suggest specific use case value.
However, context matters—for some products, shorter sessions might actually indicate successful value delivery (e.g., quick task completion).
Feedback-Based Value Metrics
Customer Feedback Sentiment Analysis
Sentiment analysis of customer feedback provides qualitative insights into satisfaction levels. Modern tools can analyze support tickets, reviews, social media mentions, and survey responses to gauge overall sentiment.
Key sentiment metrics include:
- Overall sentiment score: Average sentiment across all feedback
- Sentiment trends: Changes in sentiment over time
- Feature-specific sentiment: Sentiment toward specific features
- Sentiment by customer segment: Satisfaction across different user groups
Customer Health Score
Customer Health Score combines multiple metrics into a single indicator of customer satisfaction and value realization. This composite metric typically includes:
- Product usage frequency
- Feature adoption rates
- Support ticket volume
- Payment history
- Engagement with communications
Health scores help Agile teams prioritize customer success efforts and identify at-risk accounts before churn occurs.
Implementing Customer Satisfaction Metrics in Agile Teams
Integration with Sprint Planning
Successful Agile teams integrate customer satisfaction metrics directly into their sprint planning process. This integration ensures that customer value remains central to development decisions.
Consider incorporating metrics into:
- Sprint reviews: Present customer satisfaction data alongside feature demos
- Retrospectives: Analyze how development choices impacted customer satisfaction
- Backlog prioritization: Use satisfaction metrics to guide feature prioritization
- Definition of Done: Include satisfaction criteria in completion requirements
Continuous Feedback Loops
Continuous feedback loops ensure that customer satisfaction data flows regularly into the development process. Establish systems for:
- Real-time customer feedback collection
- Regular satisfaction surveys
- User behavior monitoring
- Customer success team collaboration
Cross-Functional Collaboration
Customer satisfaction metrics should be shared across all team functions. Developers, designers, product managers, and stakeholders must understand how their work impacts customer satisfaction.
Create shared dashboards that display:
- Real-time satisfaction scores
- Feature adoption trends
- Customer feedback summaries
- Value delivery progress
Tools and Technologies for Measuring Customer Satisfaction
Analytics Platforms
Modern analytics platforms provide comprehensive customer satisfaction tracking capabilities:
- Google Analytics: User behavior and engagement tracking
- Mixpanel: Event-based analytics and user journey mapping
- Amplitude: Product analytics and user behavior insights
- Hotjar: User session recordings and heatmap analysis
Customer Feedback Tools
Specialized tools help collect and analyze customer feedback efficiently:
- Typeform: Engaging survey creation and distribution
- SurveyMonkey: Comprehensive survey and feedback management
- Qualtrics: Enterprise-grade experience management
- UserVoice: Feature request and feedback consolidation
Customer Success Platforms
Customer success platforms provide holistic views of customer health and satisfaction:
- Gainsight: Customer success automation and analytics
- ChurnZero: Customer success and retention management
- Totango: Customer success and user analytics
- Pendo: Product analytics and user guidance
Best Practices for Value Delivery Measurement
Start with Customer Outcomes
Customer outcome focus ensures that metrics align with actual value delivery rather than internal process efficiency. Begin by identifying specific customer outcomes your product should achieve, then select metrics that measure progress toward those outcomes.
Examples of customer outcomes include:
- Increased productivity or efficiency
- Cost savings or revenue generation
- Improved decision-making capabilities
- Enhanced user experience or satisfaction
Balance Leading and Lagging Indicators
Leading indicators predict future customer satisfaction, while lagging indicators confirm past performance. Effective measurement systems include both types:
Leading indicators:
- Feature adoption rates
- User onboarding completion rates
- Support ticket trends
- Usage pattern changes
Lagging indicators:
- Customer satisfaction scores
- Net Promoter Score
- Customer lifetime value
- Churn rates
Segment Customer Data
Customer segmentation reveals satisfaction patterns across different user groups. Analyze metrics by:
- Customer size or tier
- Industry or vertical
- Usage patterns
- Geographic location
- Acquisition channel
Segmentation helps identify which customer groups find the most value and which may need additional attention.
Establish Benchmarks and Targets
Benchmarking provides context for customer satisfaction metrics. Establish benchmarks using:
- Industry standards
- Historical performance
- Competitor analysis
- Best-in-class examples
Set realistic but ambitious targets that drive continuous improvement while maintaining achievability.
Common Pitfalls and How to Avoid Them
Vanity Metrics Trap
Vanity metrics may look impressive but don’t correlate with actual customer satisfaction or business value. Examples include total downloads, page views, or registered users without context.
Focus on actionable metrics that directly relate to customer value and business outcomes.
Over-Surveying Customers
Survey fatigue can harm customer relationships and reduce response rates. Avoid over-surveying by:
- Consolidating feedback requests
- Using progressive profiling
- Implementing smart survey triggers
- Providing clear value for participation
Ignoring Qualitative Feedback
Qualitative feedback provides context that quantitative metrics cannot capture. Balance numerical data with:
- Open-ended survey responses
- Customer interview insights
- Support conversation analysis
- User behavior observations
Metrics Without Action
Actionable insights require systematic follow-up on metric findings. Establish processes for:
- Regular metric review meetings
- Root cause analysis of concerning trends
- Action plan development
- Implementation tracking
The Future of Customer Satisfaction Measurement
AI-Powered Analytics
Artificial intelligence is transforming customer satisfaction measurement through:
- Predictive analytics for churn prevention
- Natural language processing for sentiment analysis
- Automated customer health scoring
- Real-time personalization based on satisfaction data
Real-Time Feedback Systems
Real-time feedback enables immediate response to customer satisfaction issues. Emerging technologies include:
- In-app feedback widgets
- Voice sentiment analysis
- Behavioral trigger-based surveys
- Continuous customer listening platforms
Predictive Customer Success
Predictive analytics will increasingly help teams identify satisfaction issues before they impact customer relationships. Advanced models can predict:
- Customer churn probability
- Expansion opportunity likelihood
- Feature adoption success rates
- Support intervention needs
Conclusion
Customer satisfaction and value delivery metrics are essential for Agile teams committed to delivering meaningful customer outcomes. By implementing a comprehensive measurement strategy that combines satisfaction scores, behavioral data, and feedback analysis, teams can ensure their development efforts align with customer needs and expectations.
The key to success lies in selecting the right metrics for your specific context, establishing regular measurement cadences, and most importantly, acting on the insights generated. Remember that metrics are tools for improvement, not just measurement—use them to drive continuous enhancement of customer value and satisfaction.
As Agile practices continue to evolve, customer satisfaction metrics will become even more sophisticated and actionable. Teams that master these measurements today will be better positioned to deliver exceptional customer value tomorrow.
Related Posts

Value-Driven Development: Complete Guide to Maximizing Customer Value in Agile Projects
What is Value-Driven Development? Value-driven development is a software development approach that prioritizes delivering maximum customer value with every iteration,...
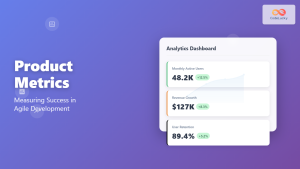
Product Metrics: Key Performance Indicators for Measuring Agile Product Success
Understanding Product Metrics in Agile Development Product metrics serve as the compass that guides Agile teams toward delivering genuine value...
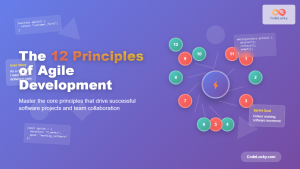
The 12 Principles of Agile Development: A Complete Guide to Agile Software Development Success
Agile development has revolutionized the software industry by prioritizing flexibility, collaboration, and customer satisfaction over rigid processes. At the heart...
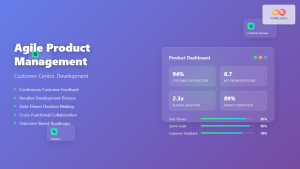
Agile Product Management: Complete Guide to Customer-Centric Development Success
What is Agile Product Management? Agile Product Management is a strategic approach that combines traditional product management principles with agile...
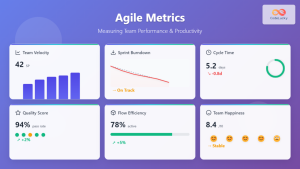
Agile Metrics: Complete Guide to Measuring Team Performance and Productivity
Measuring team performance in agile environments requires a strategic approach that goes beyond traditional project management metrics. Agile metrics provide...
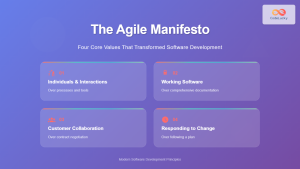
The Agile Manifesto: Four Core Values Explained for Modern Software Development
The Agile Manifesto, published in 2001 by seventeen software development thought leaders, fundamentally transformed how we approach software development. This...
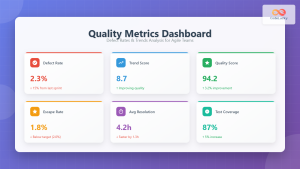
Quality Metrics: Defect Rates and Trends – Complete Guide for Agile Teams
Understanding Quality Metrics in Agile Development Quality metrics serve as the compass for Agile teams navigating the complex landscape of...
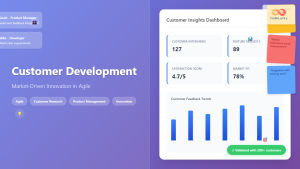
Customer Development: Complete Guide to Market-Driven Innovation in Agile
Customer development represents a fundamental shift from traditional product development, placing market validation and customer feedback at the core of...
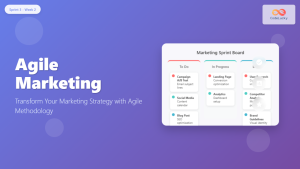
Agile Marketing: Complete Guide to Transform Your Marketing Strategy with Agile Methodology
What is Agile Marketing? Agile marketing is a strategic approach that applies the principles and practices of Agile software development...
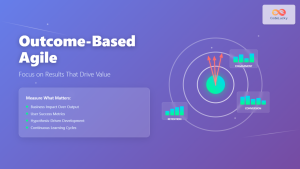
Outcome-Based Agile: Focus on Results That Drive Business Value
Traditional Agile methodologies often fall into the trap of measuring success by output metrics like story points completed, features delivered,...
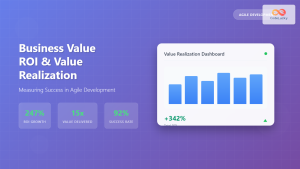
Business Value: ROI and Value Realization in Agile Development
In today's competitive business landscape, organizations investing in Agile development need more than just faster delivery—they need demonstrable business value....
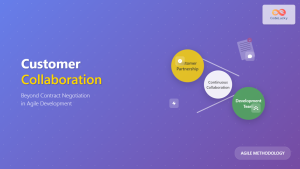
Customer Collaboration: Beyond Contract Negotiation in Agile Development
In the rapidly evolving landscape of software development, the Agile Manifesto's emphasis on "Customer collaboration over contract negotiation" has fundamentally...