In today’s fast-paced software development landscape, monitoring and observability have become critical pillars for maintaining robust production systems. As organizations embrace Agile methodologies and continuous deployment practices, the ability to gain deep insights into system behavior, performance, and user experience has never been more crucial.
This comprehensive guide explores the essential concepts, tools, and strategies needed to implement effective monitoring and observability solutions that provide actionable production insights for your development teams.
Understanding Monitoring vs Observability
While often used interchangeably, monitoring and observability serve distinct but complementary purposes in production environments. Understanding their differences is fundamental to building comprehensive system insights.
What is Monitoring?
Monitoring involves collecting, aggregating, and analyzing predetermined metrics to track system health and performance. It answers the question “Is my system working?” by focusing on known failure modes and predefined thresholds. Traditional monitoring typically includes:
- Infrastructure metrics: CPU usage, memory consumption, disk I/O, network throughput
- Application metrics: Response times, error rates, throughput, queue lengths
- Business metrics: Conversion rates, user registrations, transaction volumes
- Alerting systems: Notifications when metrics exceed defined thresholds
What is Observability?
Observability goes beyond traditional monitoring by providing the ability to understand internal system states based on external outputs. It answers “Why is my system not working?” and enables teams to debug unknown issues without prior knowledge of failure modes. The three pillars of observability include:
- Metrics: Numerical data points measured over time intervals
- Logs: Detailed records of discrete events within the system
- Traces: Records of request paths through distributed systems
The Three Pillars of Observability
Metrics: Quantifying System Behavior
Metrics provide quantitative measurements that help teams understand system performance trends and patterns. Effective metrics collection involves several key categories:
Infrastructure Metrics
Infrastructure metrics form the foundation of system observability by tracking hardware and platform-level resources. Key metrics include CPU utilization, memory usage, disk I/O operations, network bandwidth, and storage capacity. These metrics help identify resource bottlenecks and capacity planning requirements.
Application Performance Metrics
Application-level metrics focus on software performance characteristics such as response times, error rates, throughput, and concurrent user counts. These metrics directly correlate with user experience and business outcomes.
Business Metrics
Business metrics bridge the gap between technical performance and business value by tracking key performance indicators like conversion rates, revenue per transaction, user engagement metrics, and customer satisfaction scores.
Logs: Detailed Event Records
Logs provide detailed, timestamped records of events occurring within your systems. Effective log management requires structured logging practices, appropriate log levels, and centralized aggregation for analysis.
Structured Logging Best Practices
Implementing structured logging with consistent formats like JSON enables better searchability and automated analysis. Include relevant context such as request IDs, user IDs, session information, and correlation identifiers to facilitate troubleshooting across distributed systems.
Log Levels and Categories
Establish clear log level hierarchies (DEBUG, INFO, WARN, ERROR, FATAL) and categorize logs by functional areas (authentication, database operations, external API calls, business logic) to improve filtering and analysis capabilities.
Traces: Request Journey Mapping
Distributed tracing tracks requests as they flow through microservices and distributed system components, providing visibility into complex service interactions and dependencies.
Distributed Tracing Implementation
Distributed tracing involves instrumenting applications to generate span data that represents individual operations within a request. Correlation IDs link spans across service boundaries, creating complete request timelines that help identify performance bottlenecks and failure points.
Implementing Production Monitoring Strategies
Defining Key Performance Indicators (KPIs)
Successful monitoring starts with identifying the right metrics to track. Focus on indicators that directly impact user experience and business objectives rather than vanity metrics that don’t provide actionable insights.
The Four Golden Signals
Google’s Site Reliability Engineering practices recommend focusing on four golden signals:
- Latency: Time taken to service requests, including error latency
- Traffic: Demand placed on your system measured in requests per second
- Errors: Rate of failed requests, both explicit and implicit failures
- Saturation: How “full” your service is, focusing on constrained resources
Service Level Objectives (SLOs) and Error Budgets
Service Level Objectives define target reliability levels for your services, while error budgets quantify acceptable failure rates. This approach balances reliability requirements with development velocity by providing clear guidelines for when to prioritize stability over new features.
Implementing SLOs
Define SLOs based on user expectations and business requirements rather than arbitrary technical targets. Common SLO metrics include availability percentages (99.9% uptime), response time thresholds (95% of requests under 200ms), and error rates (less than 0.1% error rate).
Observability Tools and Platforms
Open Source Solutions
The observability ecosystem offers numerous open-source tools that provide enterprise-grade capabilities for organizations with technical expertise to manage them.
Prometheus and Grafana
Prometheus serves as a powerful metrics collection and alerting system, while Grafana provides visualization and dashboarding capabilities. This combination offers comprehensive monitoring for containerized and cloud-native applications.
ELK Stack (Elasticsearch, Logstash, Kibana)
The ELK Stack provides end-to-end log management from collection through analysis and visualization. Elasticsearch handles storage and search, Logstash processes and transforms log data, and Kibana offers powerful querying and visualization interfaces.
Jaeger and Zipkin
Both Jaeger and Zipkin offer distributed tracing capabilities with different implementation approaches. Jaeger, originally developed by Uber, provides comprehensive tracing with strong Kubernetes integration, while Zipkin offers a simpler deployment model suitable for smaller distributed systems.
Commercial Platforms
Commercial observability platforms provide integrated solutions that reduce operational overhead while offering advanced analytics and machine learning capabilities.
Application Performance Monitoring (APM) Solutions
Modern APM tools like Datadog, New Relic, and Dynatrace offer comprehensive observability platforms that automatically instrument applications and provide intelligent insights into performance issues and optimization opportunities.
Cloud-Native Monitoring
Cloud providers offer native monitoring solutions like AWS CloudWatch, Google Cloud Monitoring, and Azure Monitor that integrate seamlessly with cloud services while providing cost-effective scaling and management.
Real-Time Alerting and Incident Response
Intelligent Alerting Strategies
Effective alerting requires balancing comprehensive coverage with alert fatigue prevention. Implement intelligent alerting that focuses on actionable issues requiring immediate attention.
Alert Prioritization and Routing
Establish clear alert severity levels and routing rules that ensure critical issues reach the right teams immediately while non-urgent alerts are batched and reviewed during business hours. Use escalation policies that automatically involve additional team members if initial alerts aren’t acknowledged.
Reducing Alert Fatigue
Alert fatigue occurs when teams receive too many notifications, leading to important alerts being ignored. Combat this by implementing alert correlation, dynamic thresholds based on historical data, and regular alert tuning sessions to eliminate noisy or irrelevant notifications.
Incident Response Integration
Integrate monitoring and observability data directly into incident response workflows to accelerate problem resolution and reduce mean time to recovery (MTTR).
Automated Incident Creation
Configure monitoring systems to automatically create incident tickets with relevant context, affected services, and initial diagnostic information. This automation reduces response time and ensures consistent incident handling procedures.
Performance Optimization Through Data Analysis
Identifying Performance Bottlenecks
Observability data enables proactive identification of performance issues before they impact users significantly. Analyze trends and patterns to optimize system performance continuously.
Database Performance Analysis
Database monitoring involves tracking query performance, connection pool utilization, lock contention, and resource consumption. Identify slow queries, optimize indexes, and monitor replication lag to maintain optimal database performance.
Application Code Profiling
Application profiling tools integrated with observability platforms provide insights into code-level performance characteristics, including function execution times, memory allocation patterns, and CPU utilization profiles.
Capacity Planning and Scaling
Historical monitoring data supports data-driven capacity planning decisions and automated scaling policies that ensure optimal resource utilization while maintaining performance standards.
Predictive Analytics
Predictive analytics applied to monitoring data helps forecast capacity requirements, identify seasonal patterns, and optimize resource allocation across different time periods and usage scenarios.
Security and Compliance Monitoring
Security Event Monitoring
Observability extends beyond performance monitoring to include security event detection and compliance reporting. Implement comprehensive security monitoring that identifies potential threats and unauthorized access attempts.
Anomaly Detection
Anomaly detection algorithms analyze normal system behavior patterns and alert teams to deviations that might indicate security breaches, performance degradation, or system failures.
Audit Trail and Compliance
Maintain detailed audit trails through comprehensive logging that supports regulatory compliance requirements and forensic analysis capabilities when security incidents occur.
Best Practices for Production Insights
Data Retention and Storage Strategies
Implement tiered storage strategies that balance cost efficiency with data accessibility requirements. Store high-resolution data for short periods while maintaining longer-term trends at reduced granularity.
Cost Optimization
Cost optimization for observability involves carefully selecting retention periods, sampling rates, and storage tiers based on data value and access patterns. Implement data lifecycle policies that automatically archive or delete older data.
Team Collaboration and Knowledge Sharing
Foster collaboration between development, operations, and business teams by providing shared dashboards, regular review sessions, and documentation that translates technical metrics into business impact.
Dashboard Design Principles
Design dashboards that tell a story about system health and performance. Use visual hierarchy, consistent color schemes, and appropriate chart types to communicate information effectively to different audience types.
Future Trends in Monitoring and Observability
AI-Powered Observability
Machine learning and artificial intelligence are transforming observability by enabling automatic root cause analysis, predictive failure detection, and intelligent alert correlation that reduces manual investigation time.
Edge Computing Monitoring
As edge computing adoption grows, observability solutions must adapt to monitor distributed edge environments with intermittent connectivity and resource constraints while maintaining centralized visibility.
Serverless and Event-Driven Monitoring
Serverless monitoring presents unique challenges due to ephemeral execution environments and event-driven architectures. Modern observability platforms are evolving to provide comprehensive visibility into serverless function performance and cost optimization.
Implementation Roadmap
Phase 1: Foundation Building
Start with basic infrastructure monitoring, centralized logging, and essential alerting for critical services. Establish baseline metrics and SLOs for key business services.
Phase 2: Advanced Observability
Implement distributed tracing, application performance monitoring, and advanced analytics capabilities. Integrate observability data with incident response and deployment processes.
Phase 3: Optimization and Intelligence
Deploy machine learning-powered insights, predictive analytics, and automated optimization recommendations. Focus on proactive issue prevention and continuous performance improvement.
Conclusion
Monitoring and observability represent essential capabilities for modern production systems that enable teams to maintain high reliability, optimize performance, and deliver exceptional user experiences. By implementing comprehensive observability strategies that combine metrics, logs, and traces with intelligent alerting and analysis, organizations can achieve production insights that drive continuous improvement and business success.
The key to successful implementation lies in starting with clear objectives, selecting appropriate tools for your specific requirements, and gradually expanding capabilities as teams develop expertise and organizational maturity. Focus on actionable insights rather than comprehensive data collection, and always align observability investments with business outcomes and user experience improvements.
As systems continue to evolve toward greater distribution and complexity, observability will become even more critical for maintaining competitive advantage through reliable, high-performing production environments that adapt quickly to changing requirements and scale efficiently with business growth.
Related Posts
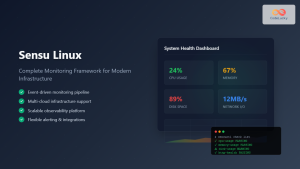
Sensu Linux: Complete Monitoring Framework Guide for System Administrators
Sensu is a powerful, open-source monitoring framework designed to monitor servers, services, application health, and business KPIs. Built with modern...
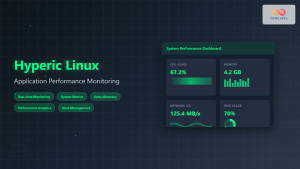
Hyperic Linux: Complete Guide to Application Performance Monitoring and System Optimization
Hyperic is a powerful open-source application performance monitoring (APM) platform that provides comprehensive insights into your Linux systems and applications....
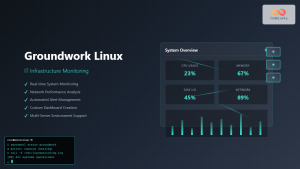
Groundwork Linux: Complete Guide to IT Infrastructure Monitoring and System Health Management
What is Groundwork Linux? Groundwork Linux is a comprehensive open-source IT infrastructure monitoring platform built specifically for Linux environments. It...
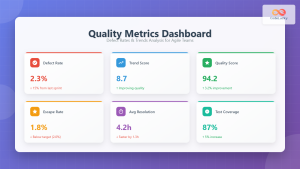
Quality Metrics: Defect Rates and Trends – Complete Guide for Agile Teams
Understanding Quality Metrics in Agile Development Quality metrics serve as the compass for Agile teams navigating the complex landscape of...
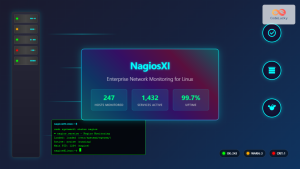
nagiosxi Linux: Complete Enterprise Network Monitoring Guide with Commands and Configuration
NagiosXI represents the pinnacle of enterprise network monitoring solutions on Linux systems, offering comprehensive infrastructure oversight with advanced alerting, reporting,...
DevOps Metrics and Optimization: Measuring Success and Driving Continuous Improvement
Welcome to the next installment in our "DevOps from Scratch" series! In our previous posts, we've explored the fundamentals of...
Zenoss Linux: Complete Guide to IT Infrastructure Monitoring and Management
What is Zenoss and Why Use it on Linux? Zenoss is a powerful, open-source IT infrastructure monitoring platform that provides...
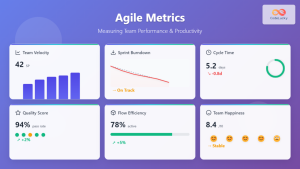
Agile Metrics: Complete Guide to Measuring Team Performance and Productivity
Measuring team performance in agile environments requires a strategic approach that goes beyond traditional project management metrics. Agile metrics provide...
MySQL Monitoring: Tools, Metrics, and Alerting Strategies
Monitoring is the unsung hero of any successful database system, and MySQL is no exception. Just like a pilot checks...
Performance Management: Agile Approach to Modern Reviews and Continuous Feedback
Understanding Agile Performance Management Traditional performance reviews often fail to capture the dynamic nature of modern software development teams. Agile...
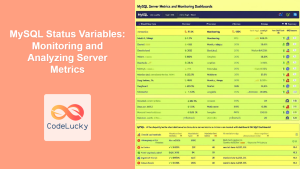
MySQL Status Variables: Monitoring and Analyzing Server Metrics
MySQL status variables are the unsung heroes of database administration, providing real-time insights into your server's inner workings. They are...
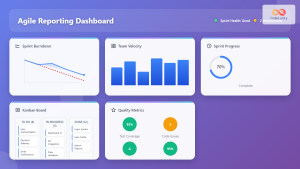
Agile Reporting: Complete Guide to Real-Time Dashboards and Performance Insights
Agile reporting transforms raw project data into actionable insights that drive successful software delivery. Unlike traditional waterfall reporting that focuses...