The GNU Debugger (GDB) is one of the most powerful and essential tools for developers working on Linux systems. As a command-line debugger, GDB allows you to examine what happens inside your programs during execution, helping you identify and fix bugs efficiently. Whether you’re debugging C, C++, Fortran, or other supported languages, mastering GDB is crucial for effective software development.
What is GDB?
GDB (GNU Debugger) is a portable debugger that runs on many Unix-like systems and works for many programming languages. It allows you to see what’s happening inside another program while it executes, or what another program was doing at the moment it crashed. GDB can perform four main kinds of operations:
- Start your program and specify conditions that might affect its behavior
- Stop your program on specified conditions
- Examine what happened when your program stopped
- Change things in your program to experiment with correcting effects
Installing GDB on Linux
Most Linux distributions come with GDB pre-installed. However, if it’s not available on your system, you can install it using your distribution’s package manager:
# Ubuntu/Debian
sudo apt update
sudo apt install gdb

# CentOS/RHEL/Fedora
sudo yum install gdb
# or for newer versions
sudo dnf install gdb

# Arch Linux
sudo pacman -S gdb
Verify the installation by checking the version:
gdb --versionPreparing Programs for Debugging
Before debugging with GDB, you need to compile your programs with debugging information. Use the -g flag with your compiler:
# Compile with debugging information
gcc -g -o myprogram myprogram.c

# For C++
g++ -g -o myprogram myprogram.cpp
Let’s create a sample program to demonstrate GDB features:
// sample.c
#include <stdio.h>

int factorial(int n) {
    if (n <= 1) {
        return 1;
    }
    return n * factorial(n - 1);
}

int main() {
    int number = 5;
    int result;

    printf("Calculating factorial of %d\n", number);
    result = factorial(number);
    printf("Factorial of %d is %d\n", number, result);

    return 0;
}
Compile this program:
gcc -g -o sample sample.cStarting GDB
There are several ways to start GDB:
# Start GDB with a program
gdb ./sample

# Start GDB and attach to a running process
gdb -p <process_id>

# Start GDB without a program
gdb
When you start GDB, you’ll see the GDB prompt:
GNU gdb (Ubuntu 9.2-0ubuntu1~20.04) 9.2
Copyright (C) 2020 Free Software Foundation, Inc.
License GPLv3+: GNU GPL version 3 or later
This is free software: you are free to change and redistribute it.
There is NO WARRANTY, to the extent permitted by law.
Type "show copying" and "show warranty" for details.
This GDB was configured as "x86_64-linux-gnu".
Type "show configuration" for configuration details.
For bug reporting instructions, please see:
<http://www.gnu.org/software/gdb/bugs/>.
Find the GDB manual and other documentation resources online at:
    <http://www.gnu.org/software/gdb/documentation/>.

For help, type "help".
Type "apropos word" to search for commands related to "word"...
Reading symbols from ./sample...
(gdb)
Essential GDB Commands
Running Programs
# Run the program
(gdb) run

# Run with command-line arguments
(gdb) run arg1 arg2 arg3

# Run with input redirection
(gdb) run < input.txt
Setting Breakpoints
Breakpoints are fundamental for debugging. They pause program execution at specific points:
# Set breakpoint at main function
(gdb) break main
Breakpoint 1 at 0x1149: file sample.c, line 9.

# Set breakpoint at specific line
(gdb) break 12

# Set breakpoint at function
(gdb) break factorial

# Set conditional breakpoint
(gdb) break 12 if number == 5

# List all breakpoints
(gdb) info breakpoints

# Delete breakpoint
(gdb) delete 1
Stepping Through Code
# Step to next line (step over function calls)
(gdb) next

# Step into function calls
(gdb) step

# Continue execution until next breakpoint
(gdb) continue

# Step one instruction
(gdb) stepi

# Finish current function
(gdb) finish
Examining Variables and Memory
Printing Variables
# Print variable value
(gdb) print number
$1 = 5

# Print with format
(gdb) print/x number    # hexadecimal
(gdb) print/d number    # decimal
(gdb) print/o number    # octal
(gdb) print/t number    # binary

# Print array elements
(gdb) print array[0]
(gdb) print array[0]@10  # print 10 elements starting from array[0]
Examining Memory
# Examine memory at address
(gdb) x/10x &number    # 10 hex words at address of number
(gdb) x/s string_ptr   # examine as string
(gdb) x/i function     # examine as instruction
Watching Variables
# Watch variable for changes
(gdb) watch number

# Watch memory location
(gdb) watch *(int*)0x12345678

# Read watchpoint (break when read)
(gdb) rwatch variable
Advanced GDB Features
Call Stack Examination
# Show call stack
(gdb) backtrace
#0  factorial (n=1) at sample.c:3
#1  0x0000555555555169 in factorial (n=2) at sample.c:6
#2  0x0000555555555169 in factorial (n=3) at sample.c:6
#3  0x0000555555555169 in factorial (n=4) at sample.c:6
#4  0x0000555555555169 in factorial (n=5) at sample.c:6
#5  0x000055555555518c in main () at sample.c:12

# Show detailed backtrace
(gdb) backtrace full

# Move up/down the call stack
(gdb) up
(gdb) down

# Go to specific frame
(gdb) frame 2
Source Code Navigation
# List source code
(gdb) list
(gdb) list 10,20       # lines 10-20
(gdb) list function    # around function

# Show current location
(gdb) where

# Set source directories
(gdb) directory /path/to/source
Multi-threaded Debugging
# Show all threads
(gdb) info threads

# Switch to thread
(gdb) thread 2

# Apply command to all threads
(gdb) thread apply all backtrace
Debugging Core Dumps
When programs crash, they may generate core dumps. GDB can analyze these:
# Enable core dumps (if disabled)
ulimit -c unlimited

# Debug core dump
gdb ./program core

# Or load core dump in existing session
(gdb) core core_file
GDB Scripting and Automation
Command Files
Create a file with GDB commands for automation:
# debug_script.gdb
set confirm off
break main
run
backtrace
continue
quit
Run GDB with the script:
gdb -x debug_script.gdb ./sampleUseful GDB Settings
# Auto-display variables
(gdb) display number

# Set pagination
(gdb) set pagination off

# Pretty print structures
(gdb) set print pretty on

# Save command history
(gdb) set history save on
Debugging Techniques and Best Practices
Strategic Breakpoint Placement
- Set breakpoints at function entry points
- Use conditional breakpoints for loops
- Place breakpoints before and after critical operations
- Use temporary breakpoints for one-time stops
# Temporary breakpoint
(gdb) tbreak main

# Conditional breakpoint
(gdb) break loop_function if i > 100
Debugging Segmentation Faults
Here’s an example program with a segmentation fault:
// segfault.c
#include <stdio.h>

int main() {
    int *ptr = NULL;
    *ptr = 42;  // This will cause segfault
    return 0;
}
Compile and debug:
gcc -g -o segfault segfault.c
gdb ./segfault
In GDB:
(gdb) run
Program received signal SIGSEGV, Segmentation fault.
0x0000555555555145 in main () at segfault.c:5
5           *ptr = 42;  // This will cause segfault

(gdb) backtrace
#0  0x0000555555555145 in main () at segfault.c:5

(gdb) print ptr
$1 = (int *) 0x0
Remote Debugging
GDB supports remote debugging, useful for embedded systems or debugging across networks:
# On target machine, start gdbserver
gdbserver localhost:1234 ./program

# On development machine
gdb ./program
(gdb) target remote localhost:1234
GUI Frontends for GDB
While GDB is primarily command-line, several GUI frontends are available:
- DDD (Data Display Debugger): Traditional X11 GUI
- Eclipse CDT: Integrated development environment
- Code::Blocks: Cross-platform IDE with GDB integration
- VS Code: With C/C++ extension supporting GDB
Common GDB Troubleshooting
No Debugging Symbols
# If you see "No symbol table info available"
# Recompile with -g flag
gcc -g -o program program.c

# Install debug packages (Ubuntu/Debian)
sudo apt install libc6-dbg
Optimized Code Issues
# Disable optimization for debugging
gcc -g -O0 -o program program.c
Permission Issues
# If attaching to process fails
echo 0 | sudo tee /proc/sys/kernel/yama/ptrace_scope
GDB Alternatives and Related Tools
While GDB is the standard, other debugging tools worth knowing:
- LLDB: LLVM’s debugger, similar syntax to GDB
- Valgrind: Memory debugging and profiling
- strace: System call tracing
- ltrace: Library call tracing
Conclusion
GDB is an indispensable tool for Linux developers, offering comprehensive debugging capabilities from basic breakpoint debugging to advanced multi-threaded analysis. By mastering GDB’s commands and techniques, you’ll significantly improve your ability to identify and resolve software bugs efficiently.
The key to becoming proficient with GDB is practice. Start with simple programs, experiment with different commands, and gradually work your way up to more complex debugging scenarios. Remember that effective debugging is not just about using tools—it’s about developing a systematic approach to problem-solving in software development.
As you continue your Linux development journey, GDB will prove to be one of your most valuable allies in creating robust, bug-free software. Keep this guide handy as a reference, and don’t hesitate to explore GDB’s extensive documentation for even more advanced features and capabilities.
Related Posts

C Debugging: Using GDB for Troubleshooting
Debugging is an essential skill for any C programmer. It's the process of finding and fixing errors in your code,...
ptrace Command Linux: Complete Guide to Process Tracing System Call
The ptrace system call is one of Linux's most powerful tools for process monitoring and debugging. It allows one process...
gcore Command Linux: Complete Guide to Generate Core Dump Files for Debugging
The gcore command in Linux is a powerful debugging tool that generates core dump files from running processes without terminating...
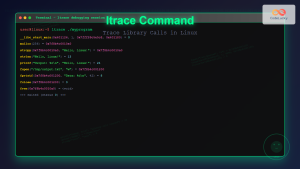
ltrace Command Linux: Complete Guide to Trace Library Calls and Debug Programs
The ltrace command is a powerful debugging and analysis tool in Linux that allows you to trace library calls made...
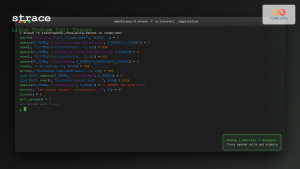
strace Command Linux: Complete Guide to System Call Tracing and Debugging
The strace command is one of the most powerful debugging and monitoring tools available in Linux systems. It allows you...
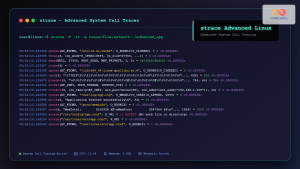
strace Advanced Linux: Complete Guide to System Call Tracing and Debugging
strace is one of the most powerful debugging and diagnostic tools available in Linux systems. It allows you to trace...
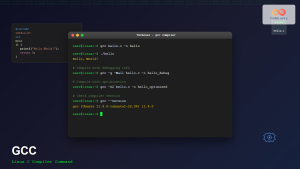
gcc Command Linux: Complete Guide to Compiling C Programs with Examples
The gcc (GNU Compiler Collection) is one of the most essential tools for C programmers working on Linux systems. This...
valgrind Command Linux: Complete Memory Debugging and Profiling Guide
Valgrind is one of the most powerful and essential tools for Linux developers and system administrators who need to debug...
debugfs Command Linux: Complete Guide to Debug Ext2/3/4 Filesystems
The debugfs command is a powerful interactive filesystem debugger for ext2, ext3, and ext4 filesystems in Linux. It provides low-level...
Core Dump Linux: Complete Guide to Debug Program Crashes and Memory Issues
A core dump is a crucial debugging tool in Linux that captures the complete memory state of a program at...
g++ Command Linux: Complete Guide to Compile C++ Programs Efficiently
The g++ command is one of the most essential tools for C++ developers working on Linux systems. As part of...
Python breakpoint() Function: Debugging with Breakpoints
Debugging is an essential skill for any programmer, and Python provides several tools to help you find and fix errors...