What is Feature Prioritization in Agile Development?
Feature prioritization is the systematic process of determining which features, user stories, or product requirements should be developed first based on their business value, user impact, and resource constraints. In agile development, effective prioritization ensures teams focus on delivering maximum value while managing limited time and resources efficiently.
The challenge lies in balancing competing demands from stakeholders, users, and business objectives. Without proper prioritization frameworks, teams often struggle with scope creep, missed deadlines, and products that fail to meet core user needs.
Why Feature Prioritization Matters
Proper feature prioritization directly impacts project success rates, team productivity, and customer satisfaction. Studies show that teams using structured prioritization methods deliver 23% more value compared to those relying on gut instinct alone.
Key benefits include:
- Resource Optimization: Allocate development time and budget to high-impact features first
- Risk Mitigation: Identify and address critical requirements early in the development cycle
- Stakeholder Alignment: Create transparency around decision-making processes
- User Value Delivery: Ensure the most valuable features reach users quickly
- Technical Debt Management: Balance new features with maintenance requirements
MoSCoW Method: Must, Should, Could, Won’t
The MoSCoW method, developed by Dai Clegg in 1994, provides a simple yet effective framework for categorizing requirements based on their criticality to project success. This technique helps teams distinguish between essential and nice-to-have features.
MoSCoW Categories Explained
Must Have (Critical Requirements)
These are non-negotiable features that define the minimum viable product. Without these requirements, the project fails to meet its core objectives. Must-have features typically represent 60% of the total effort.
Examples include:
- User authentication and security features
- Core business functionality
- Legal and compliance requirements
- Critical integrations with existing systems
Should Have (Important but Not Critical)
Important features that add significant value but don’t prevent the system from functioning. These features are often included in the first release if resources permit, typically consuming 20% of available effort.
Examples include:
- Enhanced user interface improvements
- Advanced reporting capabilities
- Performance optimizations
- Additional integrations
Could Have (Nice to Have)
Desirable features that would enhance user experience but can be deferred without significant impact. These features are often candidates for future releases, representing about 20% of total effort.
Examples include:
- Cosmetic UI enhancements
- Additional customization options
- Advanced analytics features
- Third-party tool integrations
Won’t Have (Explicitly Excluded)
Features explicitly excluded from the current scope but documented for future consideration. This category prevents scope creep and manages stakeholder expectations.
Implementing MoSCoW in Your Team
Successful MoSCoW implementation requires structured facilitation and stakeholder involvement. Start by gathering all requirements and conducting collaborative workshops where team members and stakeholders can discuss and categorize each feature.
Best practices for MoSCoW implementation:
- Involve Key Stakeholders: Include product owners, developers, and end-users in categorization sessions
- Use Time-boxing: Limit discussion time per feature to maintain momentum
- Document Rationale: Record the reasoning behind each categorization decision
- Regular Reviews: Revisit prioritization as project conditions change
- Percentage Guidelines: Aim for 60% Must, 20% Should, 20% Could distribution
Kano Model: Understanding Customer Satisfaction
The Kano Model, developed by Professor Noriaki Kano in 1984, analyzes the relationship between feature implementation and customer satisfaction. This model helps teams understand which features will truly delight users versus those that merely prevent dissatisfaction.
Kano Categories Deep Dive
Basic Needs (Must-be Quality)
These are fundamental expectations that customers assume will be present. Their absence creates dissatisfaction, but their presence doesn’t increase satisfaction significantly. Basic needs represent the foundation of any product.
Examples in software development:
- System stability and reliability
- Data security and privacy protection
- Basic functionality that defines the product category
- Reasonable performance and response times
Performance Needs (One-dimensional Quality)
Features where satisfaction increases proportionally with implementation quality. Better performance in these areas directly correlates with higher customer satisfaction.
Examples include:
- Application speed and responsiveness
- User interface intuitiveness
- Feature completeness and capability
- Integration quality with other tools
Excitement Needs (Attractive Quality)
Unexpected features that delight customers when present but don’t cause dissatisfaction when absent. These are innovation opportunities that can differentiate your product in the market.
Examples include:
- AI-powered recommendations
- Innovative user interface elements
- Surprise and delight micro-interactions
- Unique automation capabilities
Indifferent Needs
Features that neither increase nor decrease customer satisfaction. These should typically receive lower priority unless they serve other strategic purposes.
Reverse Needs
Features that actually decrease satisfaction when implemented. Identifying these helps teams avoid over-engineering or adding unwanted complexity.
Conducting Kano Analysis
Kano analysis involves surveying customers with paired questions for each feature: one asking about satisfaction if the feature is present, and another about satisfaction if it’s absent. This dual-question approach reveals the true impact of each feature on customer satisfaction.
Survey question structure:
- Functional Question: “How would you feel if this feature was present?”
- Dysfunctional Question: “How would you feel if this feature was absent?”
Response options typically include: I like it, I expect it, I’m neutral, I can live with it, I dislike it.
RICE Framework: Reach, Impact, Confidence, Effort
The RICE framework, developed by Intercom, provides a quantitative approach to feature prioritization by scoring each feature across four dimensions. This method reduces bias and creates objective prioritization criteria.
RICE Components Breakdown
Reach: How Many Users Will This Impact?
Reach measures the number of users who will encounter the feature within a specific timeframe. This metric helps teams focus on features with broad impact rather than edge cases.
Reach calculation methods:
- Absolute Numbers: Specific user counts based on analytics data
- Percentage-based: Proportion of total user base affected
- Event-based: Number of transactions or interactions per period
Impact: How Much Will This Affect Each User?
Impact measures the degree of effect on individual users, typically scored on a scale from 0.25 (minimal impact) to 3 (massive impact). This subjective measure requires team consensus and historical data validation.
Impact scoring guidelines:
- 3 = Massive Impact: Fundamental workflow changes or major value additions
- 2 = High Impact: Significant improvements to user experience
- 1 = Medium Impact: Moderate improvements with noticeable benefits
- 0.5 = Low Impact: Minor improvements or optimizations
- 0.25 = Minimal Impact: Negligible changes to user experience
Confidence: How Certain Are You About Your Estimates?
Confidence represents the team’s certainty about their Reach and Impact estimates, expressed as a percentage. This factor accounts for the inherent uncertainty in product development and prevents overconfidence bias.
Confidence levels:
- 100% = High Confidence: Strong data and evidence support estimates
- 80% = Medium Confidence: Some supporting data with reasonable assumptions
- 50% = Low Confidence: Limited data with significant assumptions
Effort: How Much Work Will This Require?
Effort estimates the total amount of work required from all team members, typically measured in “person-months.” This includes design, development, testing, and deployment time.
Effort estimation techniques:
- Bottom-up Estimation: Break features into tasks and estimate individually
- Analogous Estimation: Compare with similar features developed previously
- Expert Judgment: Leverage team experience for quick estimates
- Planning Poker: Use team consensus for more accurate estimates
RICE Score Calculation
The RICE score formula combines all four factors:
RICE Score = (Reach × Impact × Confidence) ÷ Effort
Higher RICE scores indicate higher priority features. This quantitative approach enables data-driven decision making and provides clear justification for prioritization choices.
RICE Implementation Best Practices
Successful RICE implementation requires consistent application and regular calibration. Teams should establish clear scoring criteria and regularly validate their estimates against actual outcomes.
Key implementation guidelines:
- Standardize Scoring: Create team-specific definitions for impact levels
- Use Historical Data: Calibrate estimates based on past project outcomes
- Regular Recalculation: Update RICE scores as new information becomes available
- Document Assumptions: Record the reasoning behind each score component
- Team Involvement: Include diverse perspectives in scoring sessions
Comparing Prioritization Methods
Each prioritization method serves different purposes and works best in specific contexts. Understanding when to apply each framework maximizes their effectiveness.
Method Comparison Matrix
MoSCoW Method:
- Best for: Time-constrained projects with clear scope boundaries
- Strengths: Simple, stakeholder-friendly, quick implementation
- Limitations: Subjective, limited granularity within categories
- Ideal team size: Small to medium teams (5-15 people)
Kano Model:
- Best for: Customer-centric products requiring user satisfaction optimization
- Strengths: Customer-focused, reveals satisfaction drivers, strategic insights
- Limitations: Requires customer research, time-intensive, complex analysis
- Ideal team size: Medium to large teams with research capabilities
RICE Framework:
- Best for: Data-driven organizations with quantitative culture
- Strengths: Objective scoring, scalable, reduces bias
- Limitations: Requires estimation discipline, may oversimplify complex decisions
- Ideal team size: Any size team with analytical capabilities
Combining Multiple Prioritization Methods
Advanced teams often combine multiple prioritization methods to leverage the strengths of each approach. This hybrid methodology provides more comprehensive decision-making frameworks.
Effective Combination Strategies
MoSCoW + RICE: Use MoSCoW for initial categorization, then apply RICE scoring within each category for detailed prioritization.
Kano + RICE: Leverage Kano analysis to understand customer satisfaction drivers, then use RICE scoring to prioritize within each Kano category.
Three-Phase Approach: Begin with Kano research to understand customer needs, apply MoSCoW for stakeholder alignment, and finish with RICE for detailed prioritization.
Common Prioritization Pitfalls and Solutions
Even experienced teams encounter challenges when implementing prioritization frameworks. Understanding common pitfalls helps teams avoid costly mistakes.
Frequent Mistakes
Over-prioritizing Everything: Teams often mark too many features as high priority, diluting the framework’s effectiveness. Solution: Enforce strict percentage limits for high-priority categories.
Ignoring Technical Debt: Focusing solely on new features while neglecting maintenance creates long-term problems. Solution: Allocate dedicated capacity for technical debt in each sprint.
Stakeholder Politics: Allowing organizational politics to override objective prioritization criteria undermines the framework. Solution: Establish clear governance processes and stick to documented criteria.
Estimation Accuracy Issues: Consistently poor estimates reduce framework effectiveness. Solution: Track estimate accuracy and adjust processes based on historical data.
Lack of Regular Updates: Failing to update priorities as conditions change leads to outdated prioritization. Solution: Schedule regular prioritization review sessions.
Tools and Templates for Feature Prioritization
Effective prioritization requires appropriate tools and templates to streamline the process and maintain consistency across teams.
Digital Tools
Popular prioritization tools include Jira with custom fields for RICE scoring, Productboard for comprehensive product management, and Aha! for strategic planning. Many teams also use spreadsheet templates for simpler implementations.
Template Structures
Effective prioritization templates include feature descriptions, scoring criteria, stakeholder input sections, and decision rationale documentation. Templates should be adaptable to different team sizes and project types.
Measuring Prioritization Success
Successful prioritization requires measurement and continuous improvement. Teams should track key metrics to validate their prioritization decisions and refine their processes.
Key Performance Indicators
Important metrics include feature adoption rates, customer satisfaction scores, development velocity, and business impact measurements. Regular analysis of these metrics helps teams improve their prioritization accuracy over time.
Feature Adoption Rate: Percentage of users who actively use newly released features within 30 days
Customer Satisfaction Impact: Changes in satisfaction scores following feature releases
Development Velocity: Story points or features completed per sprint
Business Impact: Revenue, conversion, or other business metrics affected by feature releases
Advanced Prioritization Techniques
Experienced teams can enhance their prioritization with advanced techniques that address specific challenges or organizational needs.
Weighted Scoring Models
Create custom scoring models that weight different criteria based on organizational priorities. This approach allows teams to adapt prioritization frameworks to their specific context and strategic objectives.
Opportunity Scoring
Measure the gap between feature importance and current satisfaction to identify improvement opportunities. This technique helps teams focus on areas where investment will yield the highest satisfaction gains.
Buy vs. Build Analysis
Include vendor solutions and integrations in prioritization decisions. This comprehensive approach ensures teams consider all options for delivering value to users.
Conclusion
Feature prioritization is a critical skill for successful agile development. The MoSCoW method provides simplicity and stakeholder alignment, the Kano Model offers customer-centric insights, and the RICE framework delivers quantitative objectivity. By understanding each method’s strengths and limitations, teams can select the most appropriate approach for their specific context.
Effective prioritization requires consistent application, regular review, and continuous improvement. Teams that master these frameworks deliver higher value products, improve customer satisfaction, and achieve better business outcomes. Start with one method that fits your team’s current capabilities, then gradually incorporate additional techniques as your prioritization maturity increases.
Remember that prioritization is an ongoing process, not a one-time activity. As market conditions change and user needs evolve, successful teams adapt their prioritization strategies while maintaining focus on delivering maximum value to their customers and stakeholders.
Related Posts
Feature Factory: Output Over Outcome – Why Agile Teams Fail to Deliver Value
What is a Feature Factory? A feature factory is an anti-pattern in Agile software development where teams prioritize shipping features...
Product Backlog Management: Complete Guide to Prioritization and Refinement Strategies
Product backlog management forms the cornerstone of successful Agile development, directly impacting team productivity, stakeholder satisfaction, and project outcomes. As...
Dependencies Management in Scaled Agile: Complete Guide to Cross-Team Coordination
Understanding Dependencies in Scaled Agile Environments Dependencies management represents one of the most critical challenges in scaled agile environments. When...
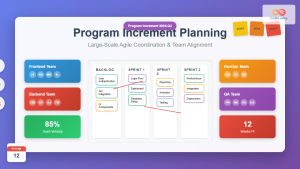
Program Increment (PI) Planning: Complete Guide to Large-Scale Agile Planning Success
What is Program Increment (PI) Planning? Program Increment (PI) Planning represents the heartbeat of large-scale Agile development, serving as a...
Time-to-Market: Accelerating Software Delivery with Agile Methodologies
In today's hyper-competitive software landscape, time-to-market has become the defining factor between market leaders and laggards. Organizations that can deliver...
User Stories: Complete Writing Guide with Examples for Agile Teams
User stories are the backbone of Agile development, serving as simple yet powerful tools that bridge the gap between technical...
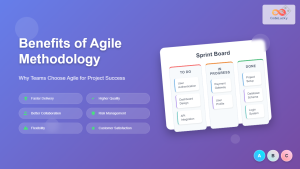
Benefits of Agile Methodology: Why Teams Choose Agile for Project Success
Agile methodology has revolutionized how teams approach project management and software development. Since its introduction through the Agile Manifesto in...
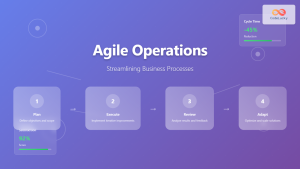
Agile Operations: Complete Guide to Streamlining Business Processes with Modern Methodologies
Agile Operations represents a transformative approach to managing business processes that combines the flexibility of agile methodologies with operational excellence....
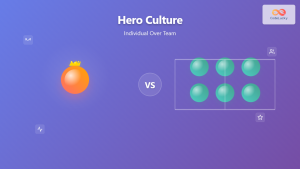
Hero Culture: Individual Over Team – Breaking the Agile Anti-Pattern
Understanding Hero Culture in Agile Development Hero culture represents one of the most pervasive anti-patterns in Agile software development, where...
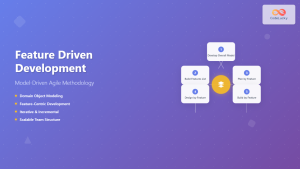
Feature Driven Development (FDD): Complete Guide to Model-Driven Agile Methodology
Feature Driven Development (FDD) stands as one of the most structured and model-centric approaches within the agile methodology family. Unlike...
Agile Project Management Tools: Complete Feature Comparison Guide 2025
Selecting the right Agile project management tool can make or break your team's productivity and project success. With dozens of...
Scaling Agile Adoption: Complete Guide to Enterprise-Wide Transformation Success
Scaling Agile adoption from a single team to an entire enterprise represents one of the most challenging yet rewarding transformations...