
The Excel TREND function is a powerful statistical tool that enables you to perform linear trend analysis and generate forecasts based on existing data patterns. This function calculates values along a linear trend line using the least squares method, making it essential for data analysts, financial professionals, and anyone working with predictive analytics.
What is the Excel TREND Function?
The TREND function returns values along a linear trend by fitting a straight line through your known data points using linear regression. It’s particularly useful for:
- Sales forecasting and revenue projections
- Market trend analysis
- Performance prediction based on historical data
- Budget planning and financial modeling
- Scientific data analysis and research
TREND Function Syntax
The complete syntax for the TREND function is:
=TREND(known_y_values, [known_x_values], [new_x_values], [const])Parameters Explained
- known_y_values (Required): The dependent variable data points you already know
- known_x_values (Optional): The independent variable data points. If omitted, Excel assumes 1, 2, 3, etc.
- new_x_values (Optional): New x-values for which you want to predict corresponding y-values
- const (Optional): TRUE or FALSE. Determines if the y-intercept should be forced to zero
Basic TREND Function Examples
Example 1: Simple Sales Forecasting
Let’s predict future sales based on historical monthly data:
| Month | Sales ($) |
|---|---|
| 1 | 10000 |
| 2 | 12000 |
| 3 | 14500 |
| 4 | 16000 |
| 5 | 18500 |
To forecast sales for months 6 and 7:
=TREND(B2:B6, A2:A6, {6;7})This formula will return the predicted sales values for months 6 and 7 based on the linear trend.
Example 2: Using TREND for Missing Data
When you have gaps in your data, TREND can help fill them:
=TREND(B2:B10, A2:A10, A5)This calculates the trend value for the x-value in cell A5, useful when you have missing data points.
Advanced TREND Function Techniques
Array Formula Implementation
For multiple predictions simultaneously, enter the TREND function as an array formula. In older Excel versions, press Ctrl+Shift+Enter after typing the formula:
=TREND(known_y_values, known_x_values, new_x_range)Working with the Const Parameter
The const parameter affects the y-intercept calculation:
- TRUE or omitted: Normal calculation with y-intercept
- FALSE: Forces the trend line through zero (y-intercept = 0)
=TREND(B2:B6, A2:A6, A7:A8, FALSE)TREND vs. FORECAST Functions
While both functions perform predictions, they have key differences:
| Feature | TREND | FORECAST |
|---|---|---|
| Array capability | Yes | No (single value) |
| Flexibility | High | Limited |
| Multiple predictions | Yes | One at a time |
| Complexity | More complex | Simpler syntax |
Practical Applications and Use Cases
Financial Planning
Use TREND for budget forecasting by analyzing historical expense patterns:
=TREND(quarterly_expenses, quarter_numbers, future_quarters)Inventory Management
Predict future inventory needs based on consumption trends:
=TREND(monthly_usage, months, projection_months)Performance Analytics
Analyze employee performance trends over time:
=TREND(performance_scores, review_periods, future_periods)Common TREND Function Errors and Solutions
#REF! Error
Occurs when array sizes don’t match. Ensure known_y_values and known_x_values have the same number of data points.
#NUM! Error
Happens when known_x_values contain duplicate values or when arrays are incorrectly sized.
#VALUE! Error
Results from non-numeric data in your arrays. Clean your data to remove text or empty cells.
Best Practices for TREND Function
Data Quality
- Ensure your data is clean and contains no text values
- Remove or handle outliers that might skew results
- Use sufficient data points for reliable trends (minimum 5-10 points)
Validation
- Compare TREND results with actual data when available
- Use multiple methods to validate forecasts
- Consider external factors that might affect trends
Documentation
- Clearly label your data ranges and assumptions
- Document the reasoning behind your trend analysis
- Include confidence intervals when presenting forecasts
Creating Visual Trend Analysis
Combine TREND with Excel charts for powerful visual analysis:
- Calculate trend values using the TREND function
- Create a scatter plot with your original data
- Add the trend line data as a new series
- Format the trend line for clear visualization
Limitations of the TREND Function
Understanding limitations helps you use TREND effectively:
- Linear assumption: Only works for linear relationships
- Past performance: Assumes historical patterns continue
- External factors: Doesn’t account for external influences
- Data quality dependent: Results are only as good as input data
Alternative Functions for Trend Analysis
Consider these alternatives for specific scenarios:
- LINEST: For detailed regression statistics
- FORECAST.LINEAR: For single-point linear forecasts
- FORECAST.ETS: For seasonal data patterns
- GROWTH: For exponential trend analysis
Conclusion
The Excel TREND function is an invaluable tool for linear trend analysis and forecasting. By understanding its syntax, applications, and limitations, you can leverage this function to make data-driven predictions and informed business decisions. Remember to validate your results, consider external factors, and use TREND as part of a comprehensive analytical approach.
Whether you’re forecasting sales, analyzing performance trends, or planning budgets, mastering the TREND function will enhance your Excel analytical capabilities and improve your decision-making process.
Related Posts
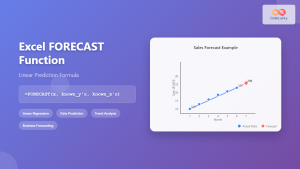
Excel FORECAST Function: Complete Guide to Linear Prediction Formula
The Excel FORECAST function is a powerful statistical tool that enables users to predict future values based on existing linear...
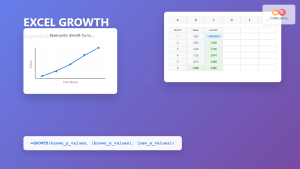
Excel GROWTH Function: Complete Guide to Exponential Growth Calculations
The Excel GROWTH function is a powerful statistical tool that calculates exponential growth by fitting data to an exponential curve....
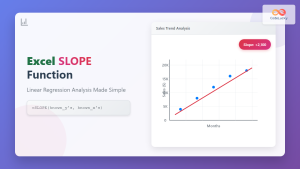
Excel SLOPE Function: Complete Guide to Linear Regression Analysis
The Excel SLOPE function is a powerful statistical tool that calculates the slope of a linear regression line through a...
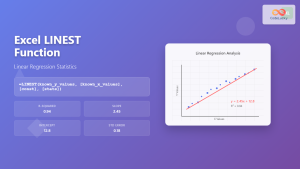
Excel LINEST Function: Complete Guide to Linear Regression Analysis
What is the Excel LINEST Function? The LINEST function in Microsoft Excel is a powerful statistical tool that performs linear...

Excel INTERCEPT Function: Complete Guide to Y-Intercept Calculations
The Excel INTERCEPT function is a powerful statistical tool that calculates the y-intercept of a linear regression line through a...
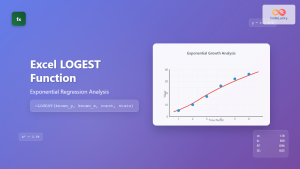
Excel LOGEST Function: Complete Guide to Exponential Regression Analysis
What is the Excel LOGEST Function? The LOGEST function in Microsoft Excel is a powerful statistical tool that performs exponential...
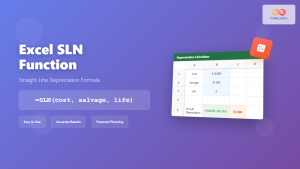
Excel SLN Function: Complete Guide to Straight Line Depreciation Calculations
The SLN function in Excel is a powerful financial tool that calculates straight-line depreciation for assets over their useful life....
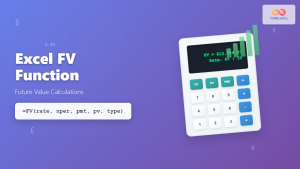
Excel FV Function: Complete Guide to Future Value Calculations
The Excel FV (Future Value) function is a powerful financial tool that calculates the future value of an investment based...
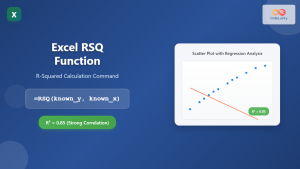
Excel RSQ Function: Complete Guide to R-Squared Calculations in Excel
What is the Excel RSQ Function? The RSQ function in Microsoft Excel calculates the square of the Pearson product-moment correlation...

Excel DB Function: Complete Guide to Declining Balance Depreciation Calculations
The Excel DB function is a powerful financial tool that calculates the depreciation of an asset using the declining balance...

Excel RATE Function: Complete Guide to Interest Rate Calculations
The Excel RATE function is a powerful financial tool that calculates the interest rate per period for an annuity or...
Excel PV Function: Master Present Value Calculations with Complete Formula Guide
The Excel PV function is one of the most powerful financial tools available in Microsoft Excel, enabling users to calculate...


