
What is the Excel LOGEST Function?
The LOGEST function in Microsoft Excel is a powerful statistical tool that performs exponential regression analysis on your data sets. Unlike linear regression, which assumes a straight-line relationship, LOGEST calculates the exponential curve that best fits your data points, making it ideal for analyzing growth patterns, decay processes, and other exponential relationships.
This function returns statistical information about the exponential curve y = b * m^x that best fits your known data points. It’s particularly useful for financial modeling, population growth analysis, radioactive decay calculations, and any scenario where data follows an exponential pattern.
LOGEST Function Syntax and Parameters
The complete syntax for the LOGEST function is:
=LOGEST(known_y_values, [known_x_values], [const], [stats])
Parameter Breakdown:
- known_y_values (Required): The array or range of y-values (dependent variables) that you want to analyze
- known_x_values (Optional): The array or range of x-values (independent variables). If omitted, Excel assumes the array {1,2,3,…}
- const (Optional): A logical value that determines whether to force the constant ‘b’ to equal 1. TRUE (default) calculates ‘b’ normally; FALSE forces ‘b’ to equal 1
- stats (Optional): A logical value that specifies whether to return additional regression statistics. TRUE returns comprehensive statistics; FALSE (default) returns only the coefficients
Understanding LOGEST Output Values
When you use LOGEST with stats=FALSE (default), it returns a horizontal array containing:
- First value (m): The base of the exponential equation
- Second value (b): The coefficient (y-intercept when x=0)
With stats=TRUE, LOGEST returns a 5-row by 2-column array containing comprehensive regression statistics:
| Row | Column 1 | Column 2 |
|---|---|---|
| 1 | m (slope coefficient) | b (y-intercept) |
| 2 | Standard error of m | Standard error of b |
| 3 | R-squared value | Standard error of y estimate |
| 4 | F statistic | Degrees of freedom |
| 5 | Regression sum of squares | Residual sum of squares |
Step-by-Step LOGEST Function Examples
Basic LOGEST Example
Let’s analyze sales growth data over 6 months:
| Month | Sales ($) |
|---|---|
| 1 | 1000 |
| 2 | 1200 |
| 3 | 1500 |
| 4 | 1800 |
| 5 | 2200 |
| 6 | 2700 |
Formula: =LOGEST(B2:B7, A2:A7)
This returns the exponential coefficients that best fit your sales data, helping you predict future growth trends.
Advanced LOGEST with Statistics
For comprehensive analysis, use: =LOGEST(B2:B7, A2:A7, TRUE, TRUE)
Remember to enter this as an array formula (Ctrl+Shift+Enter in older Excel versions) and select a 2×5 range to display all statistics.
Practical Applications of LOGEST Function
Financial Modeling
LOGEST is invaluable for analyzing compound interest, investment growth, and financial projections. Banks and financial analysts use it to model exponential growth in portfolios and predict future values based on historical performance.
Population Studies
Demographers use LOGEST to analyze population growth patterns, especially in developing regions where exponential growth models are more accurate than linear projections.
Scientific Research
In laboratory settings, LOGEST helps analyze radioactive decay, bacterial growth, chemical reaction rates, and other processes that follow exponential patterns.
Business Analytics
Companies use LOGEST for demand forecasting, user growth analysis, and market penetration studies, particularly in technology and social media sectors where exponential growth is common.
LOGEST vs LINEST: When to Use Each
Understanding when to use LOGEST versus LINEST is crucial for accurate data analysis:
Use LOGEST when:
- Data shows exponential growth or decay patterns
- Percentage change rates are consistent
- Variables have multiplicative relationships
- Analyzing compound growth scenarios
Use LINEST when:
- Data follows a straight-line pattern
- Changes are additive rather than multiplicative
- Linear relationships exist between variables
Common LOGEST Function Errors and Solutions
#NUM! Error
Cause: Negative or zero values in known_y_values array
Solution: Ensure all y-values are positive numbers, as logarithms of negative numbers are undefined
#REF! Error
Cause: Mismatched array sizes between known_y_values and known_x_values
Solution: Verify that both arrays contain the same number of data points
#VALUE! Error
Cause: Non-numeric values in data arrays
Solution: Remove or replace text values, empty cells, and logical values with appropriate numbers
Advanced LOGEST Techniques and Tips
Multiple Regression Analysis
LOGEST supports multiple independent variables for complex exponential relationships. Use multiple columns for known_x_values to analyze how several factors influence your dependent variable exponentially.
Data Preparation Best Practices
- Remove outliers that might skew results
- Ensure data points are evenly distributed
- Verify that your data actually follows an exponential pattern
- Consider data transformation if necessary
Interpreting R-squared Values
The R-squared value (coefficient of determination) indicates how well your exponential model fits the data. Values closer to 1.0 indicate better fits, while values below 0.7 suggest the exponential model may not be appropriate for your data.
Creating Exponential Forecasts with LOGEST
Once you have your LOGEST coefficients, you can create forecasts using the exponential equation y = b × m^x. This allows you to predict future values based on your exponential model.
For example, if LOGEST returns m=1.15 and b=850, your forecast formula becomes: =850*1.15^x, where x represents future time periods.
LOGEST Function Limitations and Considerations
Data Requirements
- Requires at least 3 data points for meaningful results
- All y-values must be positive
- Works best with data that genuinely follows exponential patterns
Statistical Assumptions
- Assumes exponential relationship between variables
- Requires relatively stable growth/decay rates
- May not be suitable for data with seasonal patterns
Alternative Excel Functions for Regression Analysis
While LOGEST is powerful for exponential regression, Excel offers other functions for different analytical needs:
- LINEST: Linear regression analysis
- TREND: Linear trend calculations
- GROWTH: Exponential growth predictions
- FORECAST: Simple linear forecasting
Conclusion
The Excel LOGEST function is an essential tool for anyone working with exponential data patterns. Whether you’re analyzing financial growth, population dynamics, or scientific phenomena, LOGEST provides the statistical foundation for accurate exponential regression analysis.
By understanding its syntax, parameters, and practical applications, you can leverage LOGEST to create more accurate forecasts and better understand the exponential relationships in your data. Remember to validate your results and ensure your data actually follows exponential patterns before relying on LOGEST for critical business decisions.
Practice with different datasets and explore the comprehensive statistics option to gain deeper insights into your exponential models. With proper application, LOGEST becomes a powerful ally in your data analysis toolkit.
Related Posts

Excel GROWTH Function: Complete Guide to Exponential Growth Calculations
The Excel GROWTH function is a powerful statistical tool that calculates exponential growth by fitting data to an exponential curve....

Excel EXP Function: Complete Guide to Exponential Calculations
What is the Excel EXP Function? The Excel EXP function is a powerful mathematical function that calculates the exponential value...

Excel LN Function: Complete Guide to Natural Logarithm Calculations
The Excel LN function is a powerful mathematical tool that calculates the natural logarithm of a number. Understanding how to...
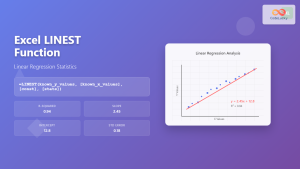
Excel LINEST Function: Complete Guide to Linear Regression Analysis
What is the Excel LINEST Function? The LINEST function in Microsoft Excel is a powerful statistical tool that performs linear...
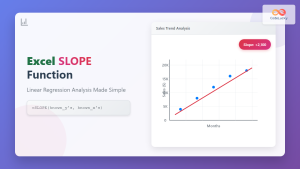
Excel SLOPE Function: Complete Guide to Linear Regression Analysis
The Excel SLOPE function is a powerful statistical tool that calculates the slope of a linear regression line through a...

Excel TREND Function: Master Linear Trend Analysis and Forecasting
The Excel TREND function is a powerful statistical tool that enables you to perform linear trend analysis and generate forecasts...
Excel LOG Function: Complete Guide to Logarithm Calculations
The Excel LOG function is a powerful mathematical tool that calculates logarithms with any specified base. Whether you're analyzing exponential...

Excel POWER Function: Complete Guide to Exponentiation Formula with Examples
What is the Excel POWER Function? The Excel POWER function is a built-in mathematical function that calculates the result of...
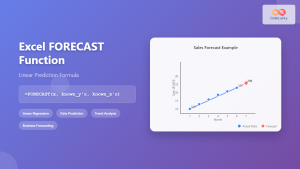
Excel FORECAST Function: Complete Guide to Linear Prediction Formula
The Excel FORECAST function is a powerful statistical tool that enables users to predict future values based on existing linear...

Excel INTERCEPT Function: Complete Guide to Y-Intercept Calculations
The Excel INTERCEPT function is a powerful statistical tool that calculates the y-intercept of a linear regression line through a...

Excel LOG10 Function: Complete Guide to Base-10 Logarithm Calculations
The Excel LOG10 function is a powerful mathematical tool that calculates the base-10 logarithm of a given number. This function...
Excel RSQ Function: Complete Guide to R-Squared Calculations in Excel
What is the Excel RSQ Function? The RSQ function in Microsoft Excel calculates the square of the Pearson product-moment correlation...


