
What is the Excel LINEST Function?
The LINEST function in Microsoft Excel is a powerful statistical tool that performs linear regression analysis on your data sets. This function calculates the statistics for a straight line that best fits your data using the least squares method, returning multiple regression statistics in an array format.
LINEST stands for “LINear ESTimation” and is essential for data analysts, researchers, and anyone working with predictive modeling or trend analysis in Excel.
LINEST Function Syntax
The complete syntax for the LINEST function is:
=LINEST(known_y_values, [known_x_values], [const], [stats])
Parameters Breakdown
- known_y_values (Required): The dependent variable values or y-values in your regression equation
- known_x_values (Optional): The independent variable values or x-values. If omitted, Excel assumes an array of {1,2,3,…}
- const (Optional): A logical value specifying whether to force the y-intercept to zero. TRUE (default) calculates the intercept normally, FALSE forces it to zero
- stats (Optional): A logical value determining additional statistics. TRUE returns comprehensive statistics, FALSE (default) returns only slope and intercept
Understanding LINEST Output
When you use LINEST with the stats parameter set to TRUE, it returns a 5-row by n-column array (where n is the number of independent variables plus 1). Here’s what each row contains:
Row 1: Regression Coefficients
Contains the slope values and y-intercept. For simple linear regression, you get the slope (m) and y-intercept (b) for the equation y = mx + b.
Row 2: Standard Errors
Shows the standard error values for each coefficient, indicating the reliability of the regression coefficients.
Row 3: R-squared and Standard Error of y
The first value is R-squared (coefficient of determination), showing how well the regression line fits the data. The second value is the standard error of the y estimate.
Row 4: F-statistic and Degrees of Freedom
Contains the F-statistic for testing the overall significance of the regression and the degrees of freedom.
Row 5: Sum of Squares
Shows the regression sum of squares and the residual sum of squares.
Step-by-Step Guide to Using LINEST
Basic LINEST Example
Let’s work through a practical example using sales data:
- Prepare your data with x-values (months) in column A and y-values (sales) in column B
- Select a range that’s at least 2 columns by 5 rows (for full statistics)
- Enter the formula:
=LINEST(B2:B13, A2:A13, TRUE, TRUE) - Press Ctrl+Shift+Enter to create an array formula
Simple Linear Regression
For basic slope and intercept calculation:
=LINEST(B2:B10, A2:A10)
This returns only the slope and y-intercept values in a horizontal array.
Advanced LINEST Applications
Multiple Linear Regression
LINEST can handle multiple independent variables. If you have data in columns A, B, and C (three x-variables) predicting values in column D:
=LINEST(D2:D20, A2:C20, TRUE, TRUE)
Polynomial Regression
You can use LINEST for polynomial regression by creating additional columns with squared, cubed, or higher-power terms of your x-variable.
Interpreting LINEST Results
Evaluating Model Quality
The R-squared value (first value in row 3) is crucial for model evaluation:
- R² > 0.8: Strong relationship, good predictive power
- 0.5 < R² < 0.8: Moderate relationship
- R² < 0.5: Weak relationship, poor predictive power
Statistical Significance
Use the F-statistic (first value in row 4) to determine if your regression model is statistically significant. Compare it with critical F-values from statistical tables.
Common LINEST Errors and Solutions
#VALUE! Error
This occurs when:
- Array sizes don’t match between x and y values
- Non-numeric data is included in the ranges
- The formula isn’t entered as an array formula
#NUM! Error
Happens when there’s insufficient data or when x-values are all the same.
#REF! Error
Results from invalid cell references in your formula.
LINEST vs Other Excel Functions
LINEST vs SLOPE and INTERCEPT
While SLOPE() and INTERCEPT() functions provide individual values, LINEST offers comprehensive regression statistics in one calculation, making it more efficient for detailed analysis.
LINEST vs TREND Function
TREND() predicts future values using linear regression, while LINEST provides the underlying statistical parameters that TREND uses internally.
Practical Applications
Sales Forecasting
Use LINEST to analyze historical sales data and predict future performance based on time trends or other variables.
Quality Control
In manufacturing, LINEST helps establish relationships between process parameters and product quality metrics.
Financial Analysis
Analyze relationships between economic indicators, stock prices, or investment returns.
Best Practices for Using LINEST
Data Preparation
- Ensure your data is clean and free from outliers
- Check for missing values and handle them appropriately
- Verify that your data meets linear regression assumptions
Model Validation
- Always examine residual plots to check model assumptions
- Use cross-validation techniques when possible
- Consider the practical significance alongside statistical significance
Alternative Methods
While LINEST is powerful, Excel also offers:
- Data Analysis ToolPak: Provides regression analysis with additional diagnostic tools
- Chart Trendlines: Visual approach with equation display
- FORECAST functions: Specialized forecasting tools for time series data
Troubleshooting Tips
Array Formula Issues
Remember to select the appropriate range size before entering your LINEST formula and always use Ctrl+Shift+Enter for array formulas.
Interpreting Complex Output
When working with multiple variables, label your output clearly to avoid confusion about which coefficient corresponds to which variable.
Conclusion
The Excel LINEST function is an invaluable tool for anyone working with statistical analysis and predictive modeling. By understanding its syntax, output structure, and practical applications, you can leverage this function to gain deeper insights from your data and make more informed decisions.
Whether you’re forecasting sales, analyzing scientific data, or exploring business relationships, mastering LINEST will significantly enhance your Excel analytics capabilities. Remember to always validate your models and consider the context of your analysis when interpreting results.
Related Posts
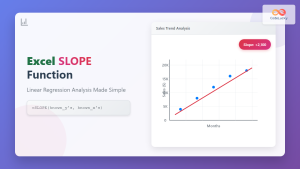
Excel SLOPE Function: Complete Guide to Linear Regression Analysis
The Excel SLOPE function is a powerful statistical tool that calculates the slope of a linear regression line through a...

Excel INTERCEPT Function: Complete Guide to Y-Intercept Calculations
The Excel INTERCEPT function is a powerful statistical tool that calculates the y-intercept of a linear regression line through a...
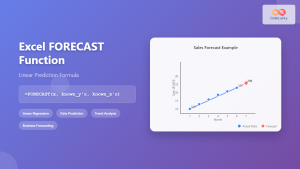
Excel FORECAST Function: Complete Guide to Linear Prediction Formula
The Excel FORECAST function is a powerful statistical tool that enables users to predict future values based on existing linear...

Excel TREND Function: Master Linear Trend Analysis and Forecasting
The Excel TREND function is a powerful statistical tool that enables you to perform linear trend analysis and generate forecasts...
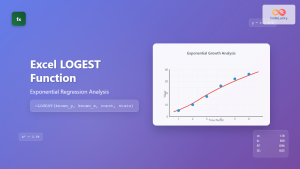
Excel LOGEST Function: Complete Guide to Exponential Regression Analysis
What is the Excel LOGEST Function? The LOGEST function in Microsoft Excel is a powerful statistical tool that performs exponential...
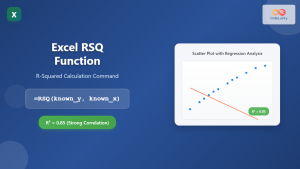
Excel RSQ Function: Complete Guide to R-Squared Calculations in Excel
What is the Excel RSQ Function? The RSQ function in Microsoft Excel calculates the square of the Pearson product-moment correlation...

Excel GROWTH Function: Complete Guide to Exponential Growth Calculations
The Excel GROWTH function is a powerful statistical tool that calculates exponential growth by fitting data to an exponential curve....

Excel COVAR Function: Complete Guide to Covariance Calculation with Examples
What is the Excel COVAR Function? The Excel COVAR function calculates the covariance between two datasets, measuring how two variables...
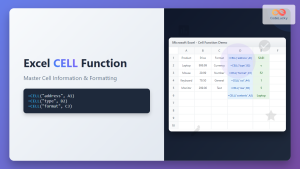
Excel CELL Function: Complete Guide to Cell Information Formula Syntax
The CELL function in Microsoft Excel is a powerful information function that returns specific details about the formatting, location, or...
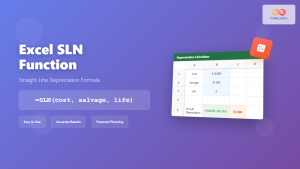
Excel SLN Function: Complete Guide to Straight Line Depreciation Calculations
The SLN function in Excel is a powerful financial tool that calculates straight-line depreciation for assets over their useful life....
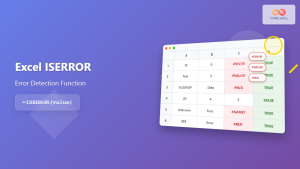
Excel ISERROR Function: Complete Guide to Error Detection and Handling
What is the Excel ISERROR Function? The ISERROR function in Microsoft Excel is a powerful logical function designed to detect...
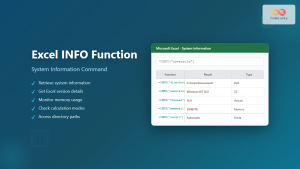
Excel INFO Function: Complete Guide to System Information Retrieval
The Excel INFO function is a powerful built-in function that retrieves system information about your current operating environment, Excel application,...


