
The Excel FORECAST function is a powerful statistical tool that enables users to predict future values based on existing linear trends in their data. This function performs linear regression calculations to estimate unknown values, making it invaluable for business forecasting, trend analysis, and data prediction tasks.
What is the Excel FORECAST Function?
The FORECAST function in Excel calculates a future value along a linear trend using existing x-values and y-values. It uses the method of least squares to determine the best-fit line through your data points and then projects this line to predict values for new x-coordinates.
This function is particularly useful for:
- Sales forecasting based on historical data
- Budget planning and financial projections
- Inventory management predictions
- Performance trend analysis
- Scientific data extrapolation
FORECAST Function Syntax
The basic syntax for the Excel FORECAST function is:
=FORECAST(x, known_y's, known_x's)Parameters Breakdown
| Parameter | Description | Data Type | Required |
|---|---|---|---|
| x | The data point for which you want to predict a value | Numeric | Yes |
| known_y’s | The array or range of dependent y-values (known results) | Array/Range | Yes |
| known_x’s | The array or range of independent x-values (known inputs) | Array/Range | Yes |
How FORECAST Function Works
The FORECAST function uses linear regression to calculate predictions. Internally, it applies the following mathematical formula:
y = a + bxWhere:
- y = predicted value
- a = y-intercept
- b = slope of the regression line
- x = input value for prediction
The function calculates the slope (b) and y-intercept (a) using these formulas:
- Slope (b) = (n×Σxy – ΣxΣy) / (n×Σx² – (Σx)²)
- Y-intercept (a) = (Σy – b×Σx) / n
Step-by-Step FORECAST Function Examples
Example 1: Basic Sales Forecasting
Let’s predict sales for month 7 based on the following data:
| Month (X) | Sales (Y) |
|---|---|
| 1 | 10000 |
| 2 | 12000 |
| 3 | 13500 |
| 4 | 15000 |
| 5 | 16800 |
| 6 | 18200 |
Formula:
=FORECAST(7, B2:B7, A2:A7)This formula will return approximately 19,743, predicting sales of $19,743 for month 7.
Example 2: Temperature Prediction
Predicting temperature at 3 PM based on hourly data:
| Hour | Temperature (°F) |
|---|---|
| 9 | 68 |
| 10 | 72 |
| 11 | 75 |
| 12 | 78 |
Formula:
=FORECAST(15, B2:B5, A2:A5)Advanced FORECAST Function Techniques
Using Named Ranges
For better formula readability, use named ranges:
=FORECAST(7, SalesData, MonthData)To create named ranges:
- Select your data range
- Go to Formulas → Define Name
- Enter a descriptive name
- Click OK
Dynamic Range References
Use dynamic ranges that automatically expand with new data:
=FORECAST(7, OFFSET(B2,0,0,COUNTA(B:B)-1,1), OFFSET(A2,0,0,COUNTA(A:A)-1,1))Multiple Forecasts with Array Formulas
Create forecasts for multiple future periods simultaneously:
=FORECAST(A10:A15, $B$2:$B$7, $A$2:$A$7)FORECAST Function Limitations and Considerations
Data Requirements
- Minimum data points: At least 2 pairs of x,y values
- Linear relationship: Works best with linear trends
- Data quality: Outliers can significantly affect results
- Range consistency: known_x’s and known_y’s must have equal lengths
When FORECAST May Not Be Suitable
- Data shows strong seasonal patterns
- Exponential or logarithmic growth trends
- Highly volatile or random data
- Non-linear relationships between variables
Common FORECAST Function Errors
#N/A Error
Cause: Arrays have different sizes or contain no numeric values
Solution: Ensure known_x’s and known_y’s ranges have equal length and contain numbers
#VALUE! Error
Cause: Text values in numeric ranges or invalid data types
Solution: Check for text entries in your data ranges and convert to numbers
#DIV/0! Error
Cause: All x-values are identical (no variance)
Solution: Ensure x-values have sufficient variation for trend calculation
FORECAST vs Related Excel Functions
FORECAST vs FORECAST.LINEAR
FORECAST.LINEAR is the newer version introduced in Excel 2016, offering identical functionality with improved precision. Use FORECAST.LINEAR for newer Excel versions.
FORECAST vs TREND
While both perform linear regression, TREND can handle multiple regression scenarios and returns arrays, making it more versatile for complex analyses.
FORECAST vs GROWTH
GROWTH function performs exponential regression, suitable for exponential growth patterns rather than linear trends.
Best Practices for Using FORECAST Function
Data Preparation
- Clean your data: Remove outliers and inconsistencies
- Check for linearity: Create scatter plots to verify linear relationships
- Use sufficient data: More data points improve forecast accuracy
- Validate results: Compare forecasts with actual outcomes when available
Accuracy Improvement Tips
- Calculate correlation coefficient (CORREL function) to assess relationship strength
- Use R-squared values to measure forecast reliability
- Apply confidence intervals around predictions
- Regularly update forecasts with new data
Troubleshooting FORECAST Function Issues
Unexpected Results
If your FORECAST results seem unreasonable:
- Verify data entry accuracy
- Check for hidden characters or formatting issues
- Confirm x and y arrays are properly aligned
- Review the scatter plot for data distribution
Performance Optimization
For large datasets:
- Use direct cell references instead of complex formulas
- Consider using pivot tables for data aggregation
- Split large calculations into smaller components
Alternative Forecasting Methods in Excel
When FORECAST function limitations become apparent, consider these alternatives:
- Exponential Smoothing: For seasonal data patterns
- Moving Averages: For short-term trend smoothing
- Polynomial Regression: For curved data relationships
- Excel’s built-in Forecast Sheet: For comprehensive forecasting with confidence intervals
Conclusion
The Excel FORECAST function provides a straightforward method for linear trend prediction, making it an essential tool for data analysis and business planning. Understanding its syntax, limitations, and best practices ensures accurate forecasting results. While perfect for linear relationships, remember to evaluate your data’s characteristics and consider alternative methods when dealing with complex patterns or non-linear trends.
Master the FORECAST function by practicing with real datasets, validating results against actual outcomes, and combining it with other Excel statistical functions for comprehensive data analysis workflows.
Related Posts

Excel TREND Function: Master Linear Trend Analysis and Forecasting
The Excel TREND function is a powerful statistical tool that enables you to perform linear trend analysis and generate forecasts...

Excel GROWTH Function: Complete Guide to Exponential Growth Calculations
The Excel GROWTH function is a powerful statistical tool that calculates exponential growth by fitting data to an exponential curve....

Excel INTERCEPT Function: Complete Guide to Y-Intercept Calculations
The Excel INTERCEPT function is a powerful statistical tool that calculates the y-intercept of a linear regression line through a...
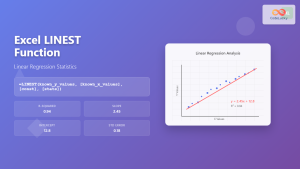
Excel LINEST Function: Complete Guide to Linear Regression Analysis
What is the Excel LINEST Function? The LINEST function in Microsoft Excel is a powerful statistical tool that performs linear...
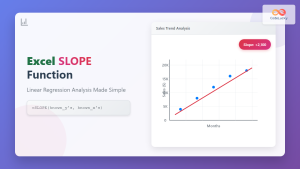
Excel SLOPE Function: Complete Guide to Linear Regression Analysis
The Excel SLOPE function is a powerful statistical tool that calculates the slope of a linear regression line through a...
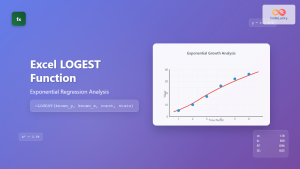
Excel LOGEST Function: Complete Guide to Exponential Regression Analysis
What is the Excel LOGEST Function? The LOGEST function in Microsoft Excel is a powerful statistical tool that performs exponential...

Excel FV Function: Complete Guide to Future Value Calculations
The Excel FV (Future Value) function is a powerful financial tool that calculates the future value of an investment based...
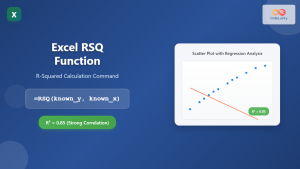
Excel RSQ Function: Complete Guide to R-Squared Calculations in Excel
What is the Excel RSQ Function? The RSQ function in Microsoft Excel calculates the square of the Pearson product-moment correlation...
Excel SLN Function: Complete Guide to Straight Line Depreciation Calculations
The SLN function in Excel is a powerful financial tool that calculates straight-line depreciation for assets over their useful life....

Excel PV Function: Master Present Value Calculations with Complete Formula Guide
The Excel PV function is one of the most powerful financial tools available in Microsoft Excel, enabling users to calculate...

Excel NPV Function: Complete Guide to Net Present Value Calculations
The Excel NPV (Net Present Value) function is one of the most powerful financial tools available in Microsoft Excel, enabling...

Excel PERCENTILE Function: Complete Guide to Statistical Analysis and Ranking
The Excel PERCENTILE function is a powerful statistical tool that helps you analyze data distribution and identify specific values within...


