CSS debugging can be one of the most challenging aspects of web development, especially when dealing with complex layouts, responsive designs, or conflicting styles. Browser Developer Tools (DevTools) provide powerful capabilities to inspect, analyze, and debug CSS efficiently. This comprehensive guide will walk you through advanced DevTools techniques that will transform your CSS debugging workflow.
Understanding Browser DevTools Interface
Modern browsers offer sophisticated debugging interfaces that provide deep insights into your CSS. Each major browser has its own implementation, but the core functionality remains consistent across Chrome, Firefox, Safari, and Edge.
Accessing DevTools
You can open DevTools using several methods:
- Keyboard shortcuts: F12 (Windows/Linux) or Cmd+Option+I (Mac)
- Right-click context menu: Select “Inspect” or “Inspect Element”
- Browser menu: Navigate to Developer Tools in your browser’s menu
Key DevTools Panels for CSS Debugging
The primary panels you’ll use for CSS debugging include:
- Elements/Inspector Panel: Shows the DOM structure with real-time CSS styles
- Computed Styles: Displays final calculated values for all CSS properties
- Layout/Box Model: Visualizes margins, borders, padding, and content areas
- Console: Displays CSS errors, warnings, and allows JavaScript manipulation
Element Inspection Fundamentals
Element inspection forms the foundation of CSS debugging. Understanding how to effectively navigate and analyze elements will significantly improve your debugging efficiency.
Selecting Elements for Inspection
There are multiple ways to select elements for inspection:
Once selected, the Elements panel will highlight the chosen element, showing its HTML structure and associated CSS rules. The corresponding styles appear in the Styles panel, organized by specificity and source.
Understanding CSS Rule Hierarchy
DevTools display CSS rules in order of specificity, with the most specific rules at the top. Overridden properties are shown with strikethrough text, helping you understand why certain styles aren’t being applied.
Example: Conflicting CSS Rules
/* Global style - lower specificity */
.button {
    background-color: blue;
    color: white;
}

/* Component-specific style - higher specificity */
.header .button {
    background-color: red; /* This will override the blue background */
}
In DevTools, you’ll see the blue background with strikethrough text, indicating it’s been overridden by the more specific red background rule.
Live CSS Editing and Testing
One of DevTools’ most powerful features is the ability to edit CSS in real-time, allowing you to test changes instantly without modifying your source files.
Inline Style Editing
You can modify existing CSS properties by clicking on their values in the Styles panel. DevTools provide auto-completion and validation as you type, making it easy to experiment with different values.
Adding New CSS Properties
To add new properties, click in an empty space within a CSS rule or use the “+” button to create entirely new rules. This is particularly useful for testing new styles or debugging layout issues.
Interactive Example: Box Shadow Editor
Many modern DevTools include visual editors for complex CSS properties. Try editing a box-shadow property:
.card {
    box-shadow: 2px 4px 8px rgba(0, 0, 0, 0.1);
}
Click on the box-shadow value in DevTools to open a visual editor where you can adjust shadow offset, blur, spread, and color using sliders and color pickers.
CSS Variable Debugging
CSS custom properties (variables) can be particularly tricky to debug. DevTools show where variables are defined and how they cascade through the document. Look for the “–” prefix in the Styles panel to identify custom properties.
Box Model Visualization
Understanding the box model is crucial for CSS layout debugging. DevTools provide excellent visualization tools for margins, borders, padding, and content areas.
Box Model Diagram
The box model diagram shows the computed values for all box model properties. Different colors represent different areas:
- Blue: Content area
- Green: Padding
- Yellow: Border
- Orange: Margin
Interactive Box Model Editing
You can directly edit box model values by clicking on the numbers in the diagram. This provides immediate visual feedback for spacing adjustments.
Debugging Layout Issues
Common layout problems and their box model signatures:
- Collapsed margins: Look for unexpected margin values
- Overflow issues: Check if content exceeds container dimensions
- Spacing inconsistencies: Compare computed values across similar elements
Advanced Debugging Techniques
Beyond basic inspection, DevTools offer sophisticated debugging capabilities for complex CSS scenarios.
CSS Grid and Flexbox Debugging
Modern layout methods require specialized debugging tools. DevTools provide grid and flexbox overlays that visualize layout structures.
Grid Inspector
When inspecting a grid container, look for the grid icon next to display: grid in the Styles panel. Clicking this icon overlays grid lines on the element, showing:
- Grid tracks and gaps
- Grid area names
- Line numbers and names
- Grid item placement
Flexbox Inspector
Similarly, flexbox containers show a flex icon that enables flexbox debugging overlays, displaying:
- Main and cross axes
- Flex item growth and shrinkage
- Alignment guides
- Available space distribution
Example: Debugging Flexbox Alignment
.flex-container {
    display: flex;
    justify-content: space-between;
    align-items: center;
    height: 100vh;
}
Enable the flexbox overlay to see how items are distributed along the main axis and aligned on the cross axis. This visual feedback makes it easy to understand why elements appear where they do.
Animation and Transition Debugging
CSS animations and transitions can be difficult to debug due to their temporal nature. DevTools provide animation timelines and playback controls.
Animation Inspector
The Animations panel (available in Chrome and Firefox) shows all running animations and allows you to:
- Pause and replay animations
- Adjust playback speed
- Inspect animation keyframes
- Visualize timing functions
Performance Impact Analysis
Animations that trigger layout or paint operations can cause performance issues. The Performance panel helps identify expensive animations by showing frame rates and rendering bottlenecks.
Responsive Design Debugging
Responsive design introduces complexity that requires specialized debugging approaches. DevTools provide comprehensive tools for testing different viewport sizes and device conditions.
Device Simulation
The device toolbar allows you to simulate various screen sizes, pixel densities, and touch interfaces. Key features include:
- Preset device profiles: iPhone, iPad, Android devices
- Custom viewport dimensions: Test specific breakpoints
- Pixel density simulation: Test high-DPI displays
- Network throttling: Simulate slow connections
Media Query Debugging
DevTools highlight active media queries and show breakpoint ranges. The media query bar above the viewport shows all defined breakpoints, making it easy to test responsive behavior.
Testing Responsive Breakpoints
@media (max-width: 768px) {
    .container {
        flex-direction: column;
        padding: 16px;
    }
}

@media (min-width: 769px) {
    .container {
        flex-direction: row;
        padding: 32px;
    }
}
Use the device toolbar to test these breakpoints by dragging the viewport width or clicking on the media query indicators.
Performance Optimization Through CSS Debugging
CSS performance issues can significantly impact user experience. DevTools provide several tools for identifying and resolving performance bottlenecks.
Rendering Performance Analysis
The Performance panel shows detailed timing information for CSS parsing, style calculation, layout, and paint operations. Look for:
- Long style recalculation times: Often caused by complex selectors
- Excessive layout thrashing: Frequent layout recalculations
- Paint optimization opportunities: Expensive visual effects
CSS Coverage Analysis
The Coverage panel identifies unused CSS rules, helping you optimize file sizes and reduce parsing time. This is particularly valuable for large applications with significant CSS bloat.
Identifying Critical CSS
Coverage analysis helps distinguish between critical CSS (needed for initial render) and non-critical CSS (used for interactions or below-the-fold content).
Browser-Specific Debugging Features
While core DevTools functionality is similar across browsers, each offers unique features that can enhance your debugging workflow.
Chrome DevTools
- CSS Overview: Provides comprehensive statistics about your CSS
- Lighthouse integration: Performance and accessibility auditing
- Security panel: Identifies mixed content and certificate issues
Firefox Developer Tools
- CSS Grid Inspector: Advanced grid debugging capabilities
- Accessibility inspector: Comprehensive a11y testing
- Font editor: Visual font property adjustment
Safari Web Inspector
- Visual effects debugging: Advanced animation and transform tools
- Memory analysis: Detailed memory usage tracking
- Touch simulation: iOS-specific interaction testing
Debugging Workflow Best Practices
Effective CSS debugging requires a systematic approach. Follow these best practices to maximize your debugging efficiency.
Systematic Problem-Solving Approach
- Reproduce the issue consistently: Ensure you can reliably trigger the problem
- Isolate the problematic element: Use element inspection to focus on specific components
- Check computed styles: Verify that CSS properties have expected values
- Trace style inheritance: Follow the cascade to understand rule application
- Test modifications incrementally: Make small changes to isolate the root cause
Documentation and Knowledge Sharing
Document your debugging discoveries for future reference and team sharing. DevTools allow you to save and export debugging sessions, making it easy to share findings with colleagues.
Common CSS Debugging Scenarios
Let’s explore some frequent CSS debugging scenarios and how to approach them systematically.
Layout Collapse Issues
When elements don’t appear as expected or seem to “collapse,” check:
- Box model properties: Verify width, height, padding, and margins
- Display property: Ensure elements have appropriate display values
- Positioning context: Check for absolute/relative positioning conflicts
- Float clearance: Look for uncleared floats affecting layout
Styling Specificity Conflicts
When styles don’t apply as expected, examine:
- Selector specificity: Use DevTools to see which rules override others
- CSS cascade order: Later rules override earlier ones with equal specificity
- Important declarations: Look for !important rules that might be causing conflicts
Cross-Browser Inconsistencies
Different browsers may render CSS differently. To debug:
- Test in multiple browsers: Use DevTools in Chrome, Firefox, and Safari
- Check vendor prefixes: Ensure appropriate prefixes for experimental properties
- Validate CSS syntax: Use built-in or external CSS validators
- Review browser support: Check compatibility for newer CSS features
Advanced DevTools Extensions and Tools
Beyond built-in DevTools, several extensions and external tools can enhance your CSS debugging capabilities.
Browser Extensions
- CSS Peeper: Extract and analyze CSS from any website
- WhatFont: Identify fonts used on web pages
- ColorZilla: Advanced color picker and palette analyzer
- PerfectPixel: Overlay design mockups for pixel-perfect comparison
External Debugging Tools
- CSS Validation Service: W3C’s official CSS validator
- Can I Use: Browser compatibility checking
- CSS Stats: Analyze CSS complexity and usage patterns
Conclusion
Mastering CSS debugging with browser DevTools is essential for efficient web development. The techniques covered in this guide provide a comprehensive foundation for diagnosing and resolving CSS issues quickly and effectively.
Remember that effective debugging is not just about using tools—it’s about developing a systematic approach to problem-solving. Start with basic element inspection, progress to advanced techniques like performance analysis, and always maintain a methodical workflow.
As web technologies continue to evolve, DevTools capabilities expand accordingly. Stay updated with the latest features in your preferred browser’s developer tools, and don’t hesitate to experiment with different debugging approaches to find what works best for your workflow.
The investment in learning these debugging techniques will pay dividends in reduced development time, improved code quality, and enhanced user experiences. Whether you’re fixing a simple alignment issue or optimizing complex animations, these DevTools techniques will serve as your reliable toolkit for CSS debugging success.
Related Posts

CSS Testing: Complete Guide to Visual Regression Testing Tools
Visual regression testing has become essential in modern web development, ensuring that CSS changes don't break the visual appearance of...
CSS Testing: Complete Guide to Cross-Browser Compatibility Testing
Cross-browser compatibility testing is one of the most critical aspects of modern web development. With users accessing websites through dozens...

CSS Feature Detection: Complete Guide to @supports Rule and Browser Compatibility
CSS feature detection is a crucial technique that allows developers to write robust, future-proof stylesheets that gracefully handle browser compatibility...

CSS Graceful Degradation: Essential Fallback Strategies for Modern Web Development
CSS graceful degradation is a fundamental web development strategy that ensures your website remains functional and accessible across all browsers,...

CSS Browser Compatibility: Essential Guide to Vendor Prefixes and Fallbacks
Browser compatibility remains one of the most critical challenges in modern web development. Different browsers implement CSS features at varying...

JavaScript Console API: Debugging Tools Explained
JavaScript Console API: Your Essential Guide to Debugging The JavaScript Console API is a vital tool for web developers, providing...

JavaScript debugger Statement: Debugging with Breakpoints
JavaScript debugger Statement: Debugging with Breakpoints The JavaScript debugger statement is a powerful debugging tool that allows you to pause...
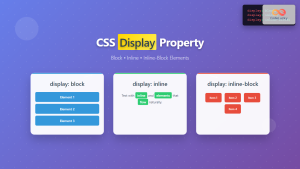
CSS Display Property: Complete Guide to Block, Inline, and Inline-Block Elements
The CSS display property is one of the most fundamental concepts in web development, controlling how elements are rendered and...

HTML CSS: Styling Your Web Pages with Selectors, Properties, and the Cascade
Introduction Ever wondered how websites go from plain text to visually stunning experiences? The magic lies in CSS (Cascading Style...

CSS Purge: Ultimate Guide to Removing Unused CSS for Lightning-Fast Performance
Website performance is crucial for user experience and SEO rankings. One of the most effective ways to improve loading times...
CSS Progressive Enhancement: Build Resilient Web Experiences Layer by Layer
Progressive enhancement in CSS is a fundamental approach that ensures your web applications remain functional and accessible across all devices,...
CSS Refactoring: Complete Guide to Modernizing Legacy Stylesheets
Legacy CSS codebases can become a significant burden on development teams, slowing down feature delivery and creating maintenance nightmares. CSS...