Valgrind is one of the most powerful and essential tools for Linux developers and system administrators who need to debug memory-related issues and profile application performance. This comprehensive guide will walk you through everything you need to know about the valgrind command, from basic usage to advanced profiling techniques.
What is Valgrind?
Valgrind is an instrumentation framework for building dynamic analysis tools. It consists of a core that provides a synthetic CPU in software, and a series of debugging and profiling tools. The most commonly used tool is Memcheck, which can detect memory-management problems in C and C++ programs.
Key Features of Valgrind
- Memory leak detection – Identifies unfreed memory allocations
- Buffer overflow detection – Catches reads/writes beyond allocated memory
- Use of uninitialized memory – Detects access to uninitialized variables
- Performance profiling – Analyzes cache usage and call graphs
- Thread error detection – Identifies race conditions and deadlocks
Installing Valgrind
Before using valgrind, you need to install it on your Linux system:
Ubuntu/Debian:
sudo apt update
sudo apt install valgrind
CentOS/RHEL/Fedora:
# For CentOS/RHEL
sudo yum install valgrind

# For Fedora
sudo dnf install valgrind
Arch Linux:
sudo pacman -S valgrindBasic Valgrind Syntax
The basic syntax for using valgrind is:
valgrind [valgrind-options] your-program [program-arguments]The most common usage is:
valgrind --tool=memcheck --leak-check=full ./your_programValgrind Tools Overview
Valgrind comes with several specialized tools:
| Tool | Purpose |
|---|---|
| Memcheck | Memory error detector (default) |
| Cachegrind | Cache and branch-prediction profiler |
| Callgrind | Call-graph generating cache profiler |
| Helgrind | Thread error detector |
| Massif | Heap profiler |
Using Memcheck for Memory Debugging
Memcheck is the most frequently used valgrind tool. Let’s create a sample C program with memory issues to demonstrate its capabilities:
Sample Program with Memory Issues
// memory_test.c
#include <stdio.h>
#include <stdlib.h>
#include <string.h>

int main() {
    // Memory leak - malloc without free
    char *ptr1 = malloc(100);
    strcpy(ptr1, "Hello World");

    // Buffer overflow
    char *ptr2 = malloc(10);
    strcpy(ptr2, "This string is too long for the buffer");

    // Use after free
    free(ptr2);
    printf("Value: %s\n", ptr2);

    // Double free (commented to avoid crash)
    // free(ptr2);

    return 0;
}
Compile the program:
gcc -g -o memory_test memory_test.cRun with valgrind:
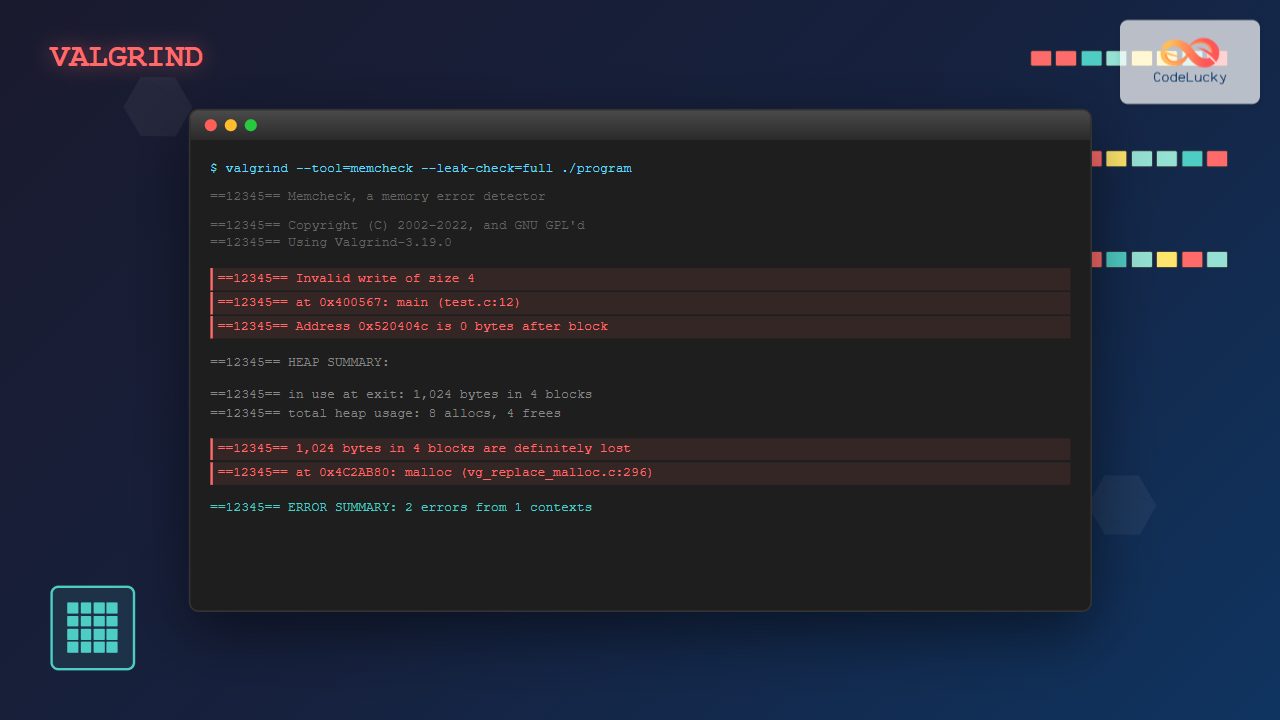
valgrind --tool=memcheck --leak-check=full --show-leak-kinds=all --track-origins=yes ./memory_testSample Output Analysis
==12345== Memcheck, a memory error detector
==12345== Copyright (C) 2002-2017, and GNU GPL'd, by Julian Seward et al.
==12345== Using Valgrind-3.15.0 and LibVEX; rerun with -h for copyright info
==12345== Command: ./memory_test
==12345==
==12345== Invalid write of size 1
==12345==    at 0x4C32C27: strcpy (in /usr/lib/valgrind/vgpreload_memcheck-amd64-linux.so)
==12345==    by 0x40059B: main (memory_test.c:11)
==12345==  Address 0x5204049 is 9 bytes after a block of size 10 alloc'd
==12345==    at 0x4C29C23: malloc (in /usr/lib/valgrind/vgpreload_memcheck-amd64-linux.so)
==12345==    by 0x40058B: main (memory_test.c:10)
==12345==
==12345== Invalid read of size 1
==12345==    at 0x4C33164: strlen (in /usr/lib/valgrind/vgpreload_memcheck-amd64-linux.so)
==12345==    by 0x4E810B8: puts (ioputs.c:35)
==12345==    by 0x4005C8: main (memory_test.c:15)
==12345==  Address 0x5204040 is 0 bytes inside a block of size 10 free'd
==12345==    at 0x4C2A06D: free (in /usr/lib/valgrind/vgpreload_memcheck-amd64-linux.so)
==12345==    by 0x4005B9: main (memory_test.c:14)
==12345==
==12345== HEAP SUMMARY:
==12345==     in use at exit: 100 bytes in 1 blocks
==12345==   total heap usage: 2 allocs, 1 frees, 110 bytes allocated
==12345==
==12345== 100 bytes in 1 blocks are definitely lost in loss record 1 of 1
==12345==    at 0x4C29C23: malloc (in /usr/lib/valgrind/vgpreload_memcheck-amd64-linux.so)
==12345==    by 0x400571: main (memory_test.c:7)
==12345==
==12345== LEAK SUMMARY:
==12345==     definitely lost: 100 bytes in 1 blocks
==12345==     indirectly lost: 0 bytes in 0 blocks
==12345==       possibly lost: 0 bytes in 0 blocks
==12345==     still reachable: 0 bytes in 0 blocks
==12345==         suppressed: 0 bytes in 0 blocks
Common Valgrind Options
Essential Memcheck Options
--leak-check=full– Detailed leak detection--show-leak-kinds=all– Show all types of leaks--track-origins=yes– Track origins of uninitialized values--verbose– More detailed output--log-file=filename– Save output to file
Performance Options
--time-stamp=yes– Add timestamps to output--num-callers=20– Show more call stack frames--malloc-fill=0xde– Fill malloc’d areas with specific value--free-fill=0xdf– Fill free’d areas with specific value
Advanced Profiling with Callgrind
Callgrind is excellent for performance profiling and understanding program execution flow:
valgrind --tool=callgrind ./your_programThis generates a callgrind.out.[pid] file that can be visualized using KCachegrind:
# Install KCachegrind
sudo apt install kcachegrind

# View the profile
kcachegrind callgrind.out.12345
Callgrind Example
// profile_test.c
#include <stdio.h>

void expensive_function() {
    int sum = 0;
    for(int i = 0; i < 1000000; i++) {
        sum += i * i;
    }
    printf("Sum: %d\n", sum);
}

void another_function() {
    for(int i = 0; i < 100; i++) {
        expensive_function();
    }
}

int main() {
    another_function();
    return 0;
}
Compile and profile:
gcc -g -o profile_test profile_test.c
valgrind --tool=callgrind --callgrind-out-file=profile.out ./profile_test
Heap Profiling with Massif
Massif tracks heap memory usage over time:
valgrind --tool=massif ./your_programView the results:
ms_print massif.out.12345Massif Output Example
--------------------------------------------------------------------------------
Command:            ./memory_test
Massif arguments:   (none)
ms_print arguments: massif.out.12345
--------------------------------------------------------------------------------

    KB
1.000^                                                                       #
     |                                                                      :#
     |                                                                   @@@:#
     |                                                                @@@::::#
     |                                                             @@@@:::::::
     |                                                          @@@::::::::::#
     |                                                       @@@@:::::::::::::#
     |                                                    @@@@@::::::::::::::#
     |                                                 @@@@::::::::::::::::#
     |                                              @@@@@:::::::::::::::::::#
     |                                           @@@@:::::::::::::::::::::#
     |                                        @@@@@::::::::::::::::::::::#
     |                                     @@@@:::::::::::::::::::::::::#
     |                                  @@@@@:::::::::::::::::::::::::::#
     |                               @@@@::::::::::::::::::::::::::::::#
     |                            @@@@@::::::::::::::::::::::::::::::::
     |                         @@@@:::::::::::::::::::::::::::::::::::
     |                      @@@@@:::::::::::::::::::::::::::::::::::#
     |                   @@@@:::::::::::::::::::::::::::::::::::::#
     |                @@@@@::::::::::::::::::::::::::::::::::::::#
   0 +--------------------------------------------------------------------->ki
     0                                                                   1.000

Number of snapshots: 25
 Detailed snapshots: [9, 19 (peak)]
Thread Debugging with Helgrind
Helgrind detects race conditions and thread synchronization errors:
valgrind --tool=helgrind ./threaded_programThread Error Example
// thread_test.c
#include <pthread.h>
#include <stdio.h>

int shared_variable = 0;

void* thread_function(void* arg) {
    for(int i = 0; i < 1000; i++) {
        shared_variable++;  // Race condition!
    }
    return NULL;
}

int main() {
    pthread_t thread1, thread2;

    pthread_create(&thread1, NULL, thread_function, NULL);
    pthread_create(&thread2, NULL, thread_function, NULL);

    pthread_join(thread1, NULL);
    pthread_join(thread2, NULL);

    printf("Final value: %d\n", shared_variable);
    return 0;
}
Compile and run:
gcc -g -pthread -o thread_test thread_test.c
valgrind --tool=helgrind ./thread_test
Practical Valgrind Tips and Best Practices
1. Compile with Debug Information
Always compile your programs with the -g flag to get meaningful stack traces:
gcc -g -O0 -o program program.c2. Use Suppression Files
Create suppression files for known false positives:
valgrind --gen-suppressions=all ./program 2> suppressions.txt
valgrind --suppressions=suppressions.txt ./program
3. Environment Variables
Set useful environment variables:
export VALGRIND_OPTS="--leak-check=full --show-leak-kinds=all"
valgrind $VALGRIND_OPTS ./program
4. Integration with Build Systems
Add valgrind targets to your Makefile:
valgrind-check: $(TARGET)
	valgrind --leak-check=full --error-exitcode=1 ./$(TARGET)

valgrind-profile: $(TARGET)
	valgrind --tool=callgrind ./$(TARGET)
Performance Considerations
Valgrind significantly slows down program execution (typically 10-50x slower). Consider these factors:
- Use appropriate tools – Don’t use Memcheck for performance profiling
- Profile representative data – Use realistic input sizes
- Focus on hotspots – Use sampling for large applications
- Disable optimizations – Use
-O0for debugging
Common Error Types and Solutions
Memory Leaks
Error: “definitely lost” or “possibly lost” memory
Solution: Ensure every malloc() has a corresponding free()
Buffer Overflows
Error: “Invalid write/read of size N”
Solution: Check array bounds and string operations
Use After Free
Error: “Invalid read/write” after free
Solution: Set pointers to NULL after freeing
Automating Valgrind Checks
Create a script for automated testing:
#!/bin/bash
# valgrind_check.sh

PROGRAM=$1
LOGFILE="valgrind_$(date +%Y%m%d_%H%M%S).log"

echo "Running Valgrind on $PROGRAM..."

valgrind \
    --tool=memcheck \
    --leak-check=full \
    --show-leak-kinds=all \
    --track-origins=yes \
    --verbose \
    --log-file=$LOGFILE \
    --error-exitcode=1 \
    $PROGRAM

if [ $? -eq 0 ]; then
    echo "✅ No memory errors detected"
else
    echo "❌ Memory errors found. Check $LOGFILE"
    exit 1
fi
Conclusion
Valgrind is an indispensable tool for Linux developers working with C/C++ applications. Its comprehensive suite of debugging and profiling tools can help identify memory leaks, buffer overflows, race conditions, and performance bottlenecks. By incorporating valgrind into your development workflow, you can significantly improve the reliability and performance of your applications.
Remember to use valgrind regularly during development, not just when problems arise. The earlier you catch memory-related issues, the easier they are to fix. With the knowledge and examples provided in this guide, you’re well-equipped to leverage valgrind’s powerful capabilities for your memory debugging and profiling needs.

