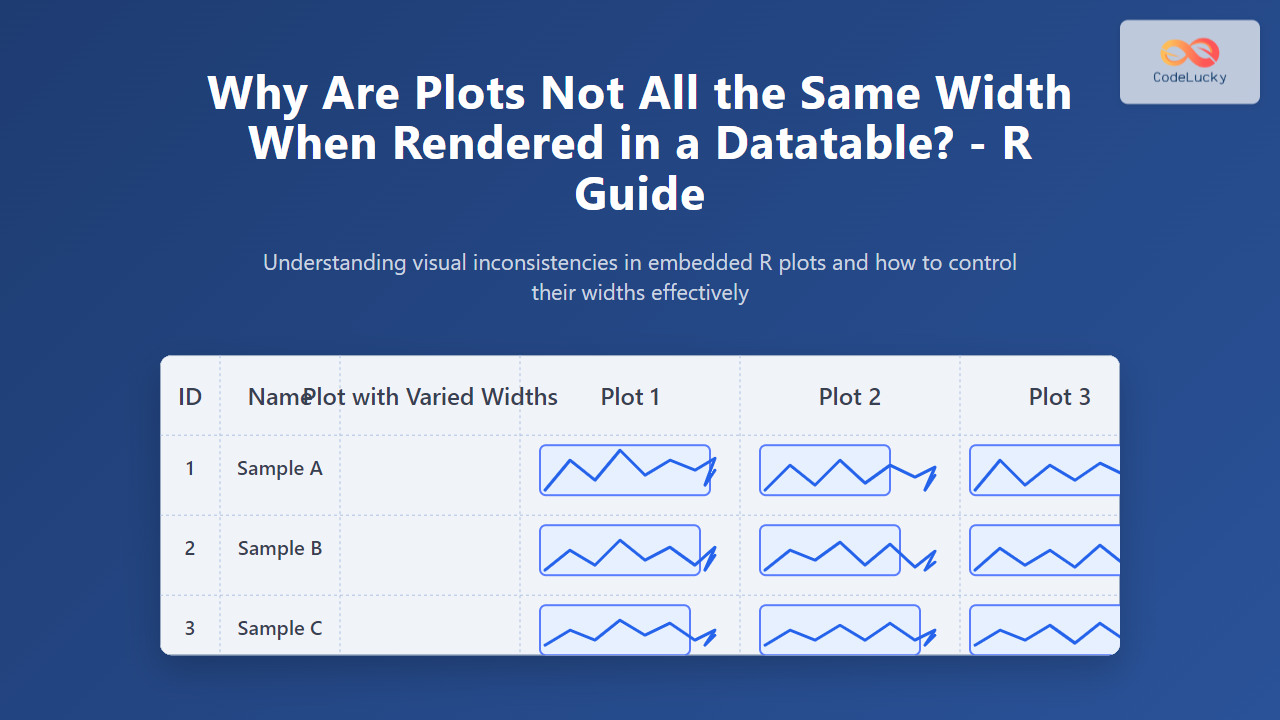
Why Are Plots Not All the Same Width When Rendered in a Datatable? – R GuideCodeLucky2025-08-30T23:43:19+05:30August 30, 2025|
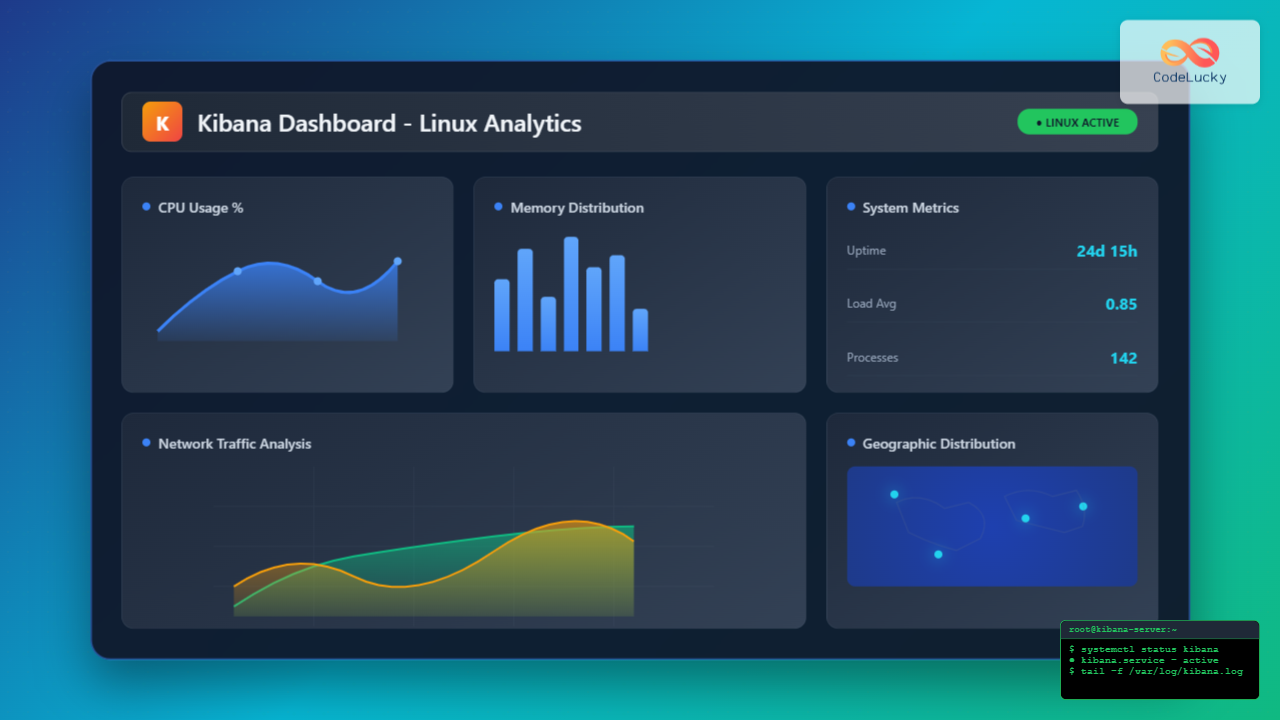
Kibana Linux: Complete Guide to Data Visualization Dashboard Setup and ManagementCodeLucky2025-08-27T16:43:31+05:30August 26, 2025|
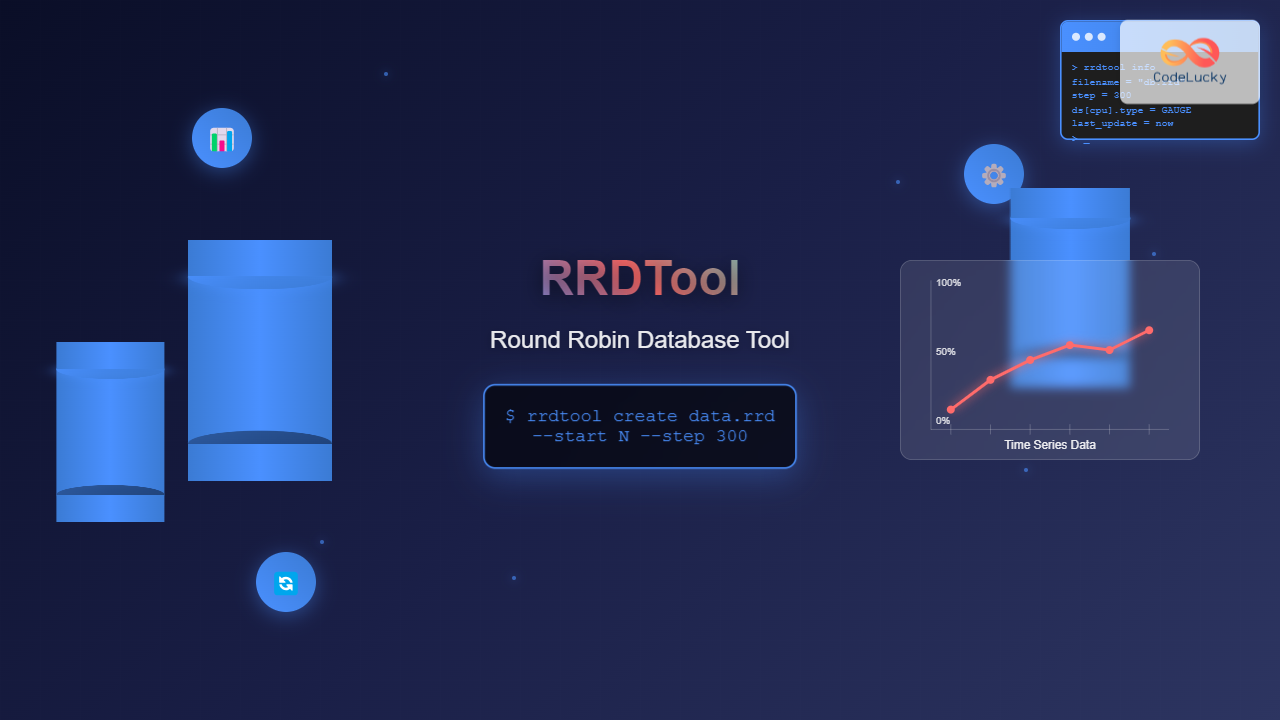
rrdtool Command Linux: Complete Guide to Round Robin Database ToolCodeLucky2025-08-27T16:47:55+05:30August 26, 2025|
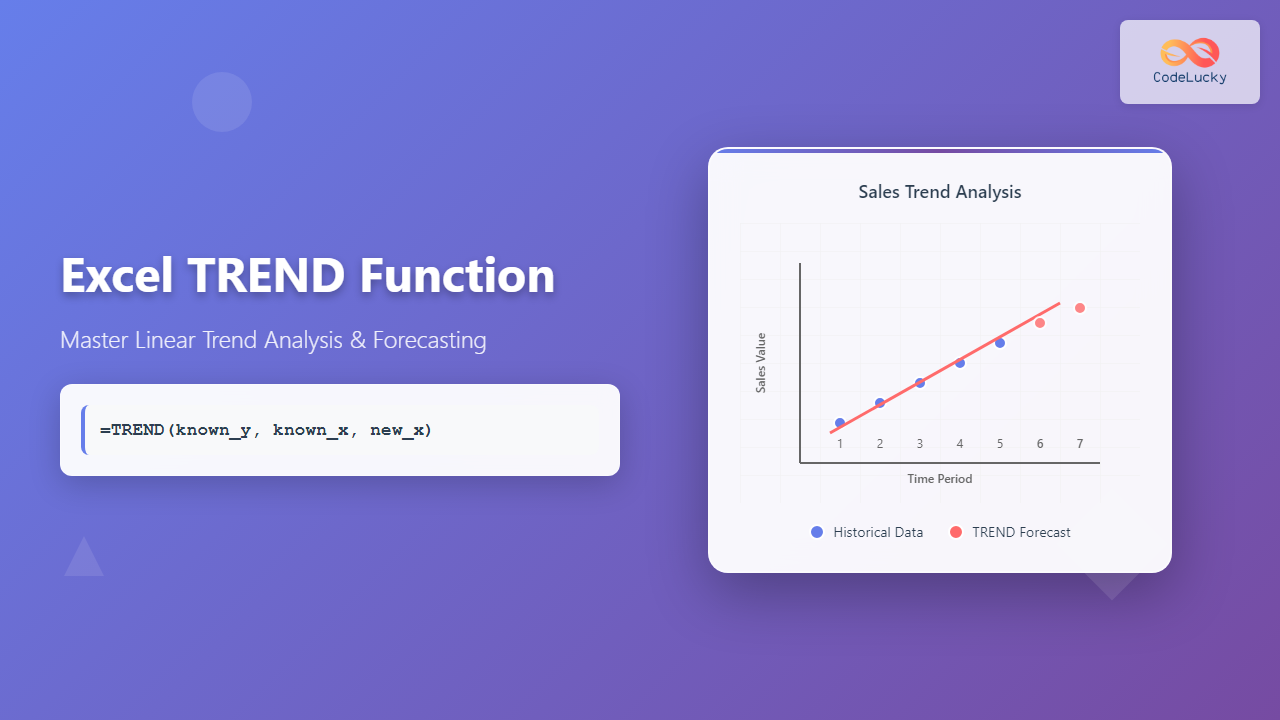
Excel TREND Function: Master Linear Trend Analysis and ForecastingCodeLucky2025-08-27T17:11:36+05:30June 9, 2025|
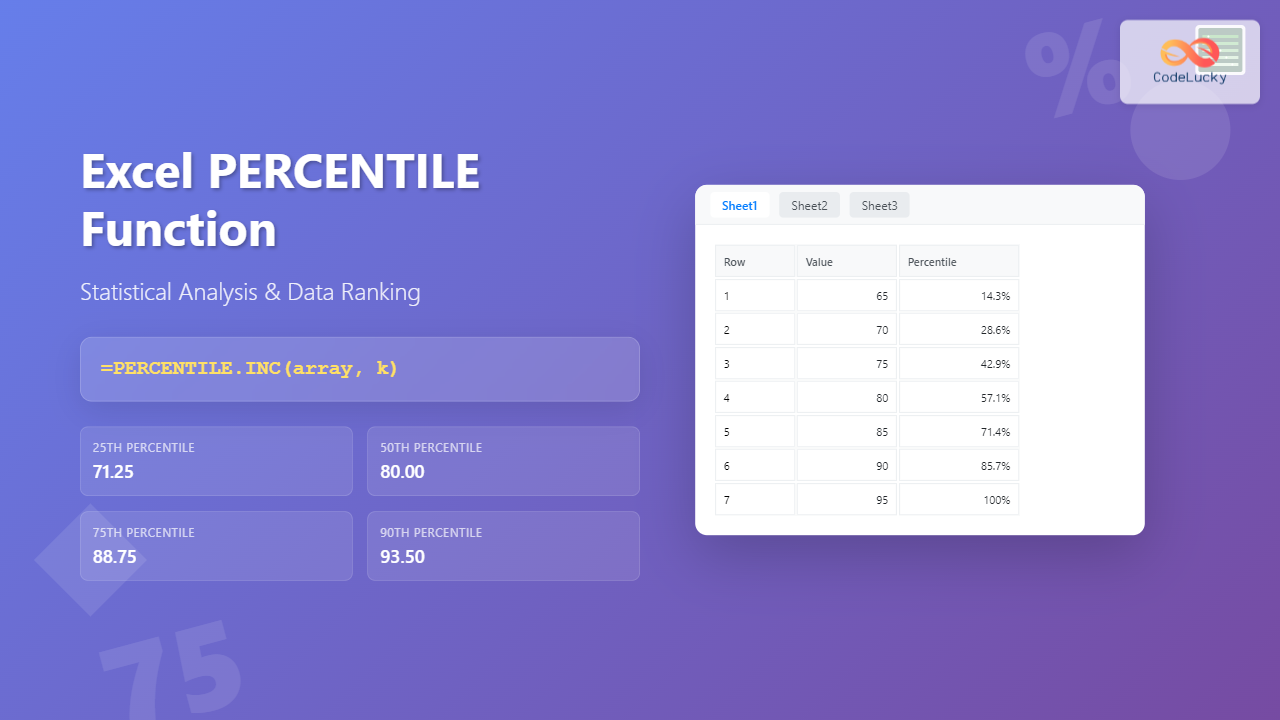
Excel PERCENTILE Function: Complete Guide to Statistical Analysis and RankingCodeLucky2025-08-27T17:13:51+05:30June 8, 2025|
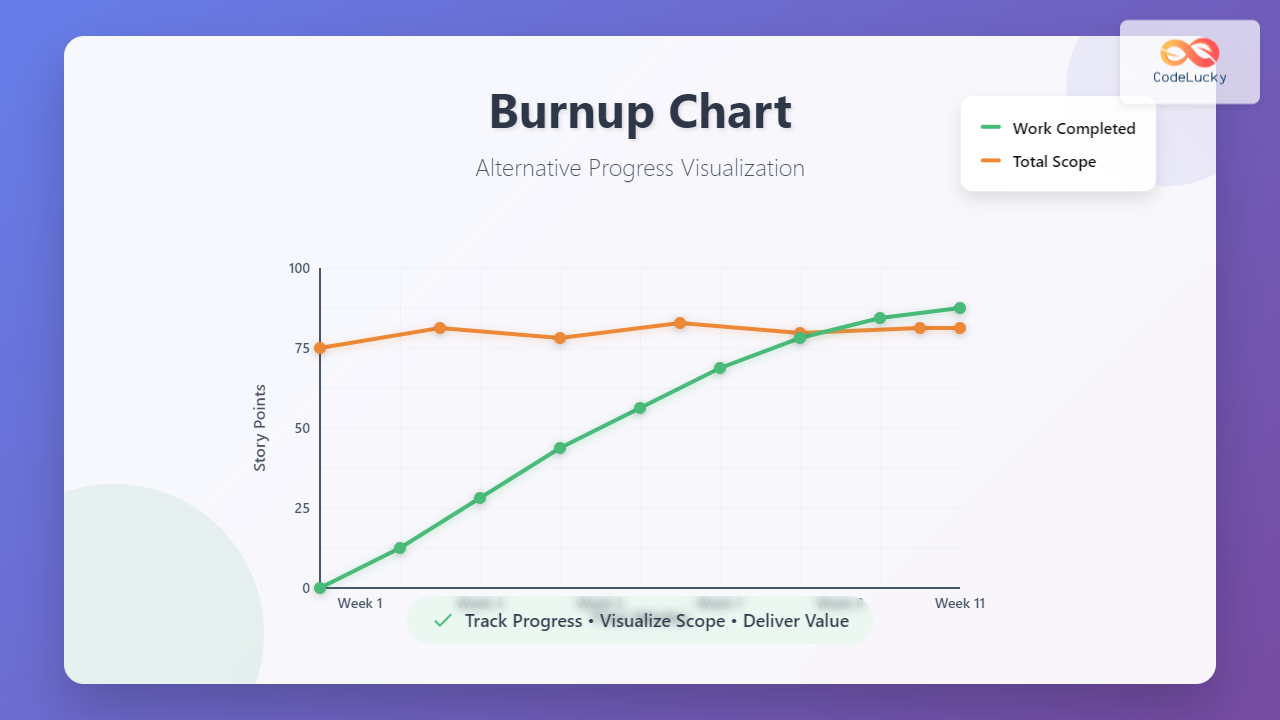
Burnup Chart: Complete Guide to Alternative Progress Visualization in Agile ProjectsCodeLucky2025-08-27T17:30:02+05:30May 29, 2025|