Resource Allocation Graphs (RAG) serve as powerful visual tools in operating systems for detecting and preventing deadlocks. This comprehensive guide explores how these graphs work, their construction, analysis techniques, and practical applications in modern computing systems.
What is a Resource Allocation Graph?
A Resource Allocation Graph is a directed graph that represents the allocation of resources to processes and the requests made by processes for resources. It provides a visual representation of the current state of resource allocation in an operating system, making it easier to identify potential deadlock situations.
The graph consists of two types of nodes:
- Process nodes – represented as circles, indicating active processes
- Resource nodes – represented as rectangles, indicating system resources
Two types of directed edges connect these nodes:
- Request edges – arrows from processes to resources (process requesting a resource)
- Assignment edges – arrows from resources to processes (resource allocated to a process)

Components and Notation
Graph Elements
Understanding the basic elements of a Resource Allocation Graph is crucial for proper analysis:
| Element | Representation | Description |
|---|---|---|
| Process | Circle (Pi) | Active process in the system |
| Resource Type | Rectangle (Ri) | Type of resource available |
| Resource Instance | Dots within rectangle | Individual instances of resource type |
| Request Edge | Pi → Ri | Process requesting resource |
| Assignment Edge | Ri → Pi | Resource allocated to process |
Multiple Resource Instances
When a resource type has multiple instances, each instance is represented by a dot within the resource rectangle. This distinction is important because:
- Multiple instances allow for concurrent allocation
- Deadlock analysis differs for single vs. multiple instance resources
- Resource availability affects scheduling decisions
Constructing Resource Allocation Graphs
Step-by-Step Construction
Building an accurate RAG requires systematic approach:
- Identify all processes currently in the system
- Identify all resource types and their instances
- Draw process nodes as circles
- Draw resource nodes as rectangles with dots for instances
- Add request edges from processes to needed resources
- Add assignment edges from allocated resources to processes
Example Construction
Consider a system with three processes (P1, P2, P3) and two resource types (R1 with 2 instances, R2 with 1 instance):

Deadlock Detection Using RAG
Cycle Detection Method
The primary method for deadlock detection in Resource Allocation Graphs involves cycle detection. The relationship between cycles and deadlocks depends on resource instances:
Single Instance Resources
For resources with single instances:
- Cycle exists = Deadlock exists
- No cycle = No deadlock
Multiple Instance Resources
For resources with multiple instances:
- Cycle exists ≠ Deadlock necessarily exists
- No cycle = No deadlock
- Additional analysis required when cycles are present
Deadlock Detection Algorithm
The detection algorithm follows these steps:
- Find cycles in the graph using depth-first search
- If no cycles exist, no deadlock is present
- If cycles exist:
- For single-instance resources: deadlock exists
- For multi-instance resources: perform resource availability analysis

Practical Examples
Example 1: Simple Deadlock
Consider two processes competing for two resources:
- Process P1 holds R1, requests R2
- Process P2 holds R2, requests R1

Analysis: The graph shows a clear cycle (P1 → R2 → P2 → R1 → P1), indicating a deadlock situation with single-instance resources.
Example 2: No Deadlock Despite Requests
This example demonstrates a situation where processes are waiting but no deadlock exists:
- Process P1 holds R1, requests R2
- Process P2 holds R2 (1 of 2 instances)
- Process P3 requests R2

Analysis: No cycles exist in this graph. P2 can complete and release R2, allowing either P1 or P3 to proceed.
Advanced RAG Analysis
Resource Availability Vector
For complex scenarios with multiple resource instances, maintain an availability vector that tracks:
- Total instances of each resource type
- Currently allocated instances
- Available instances for new allocations
Request Matrix Analysis
Advanced analysis involves creating matrices to represent:
| Matrix | Purpose | Dimensions |
|---|---|---|
| Allocation Matrix | Current resource allocation | n × m (processes × resources) |
| Request Matrix | Pending resource requests | n × m (processes × resources) |
| Available Vector | Available resource instances | 1 × m (resource types) |
Deadlock Prevention and Avoidance
Prevention Strategies
RAGs help implement deadlock prevention by ensuring certain conditions never occur:
- Mutual Exclusion – Some resources must be exclusive
- Hold and Wait – Prevent processes from holding resources while waiting
- No Preemption – Allow resource preemption when possible
- Circular Wait – Impose ordering on resource acquisition
Avoidance Using RAG
The Banker’s Algorithm uses RAG principles for deadlock avoidance:
- Maintain safe state through resource allocation
- Check if granting a request leads to unsafe state
- Only grant requests that maintain system safety
Implementation Considerations
Time Complexity
RAG operations have specific complexity characteristics:
- Cycle detection: O(V + E) using DFS
- Graph construction: O(P + R) for P processes and R resources
- Deadlock detection: O(V + E) for simple cases
Space Complexity
Memory requirements include:
- Adjacency lists: O(V + E) for graph representation
- Matrices: O(P × R) for allocation and request matrices
- Auxiliary structures: O(V) for cycle detection
Real-World Applications
Database Systems
RAGs are extensively used in database management for:
- Lock management – Tracking table and row locks
- Transaction scheduling – Preventing transaction deadlocks
- Resource allocation – Managing buffer pools and connections
Operating System Kernels
Modern operating systems implement RAG concepts for:
- Process synchronization – Mutex and semaphore management
- Memory management – Page allocation and swapping
- I/O scheduling – Device allocation and queuing
Distributed Systems
In distributed environments, RAGs help with:
- Distributed deadlock detection – Across multiple nodes
- Resource coordination – Global resource management
- Consistency maintenance – Preventing conflicts
Optimization Techniques
Graph Reduction
Optimize RAG analysis through:
- Node elimination – Remove completed processes
- Edge reduction – Simplify satisfied requests
- Subgraph analysis – Focus on problematic regions
Incremental Updates
Maintain efficiency with:
- Dynamic graph modification – Update without reconstruction
- Lazy evaluation – Compute only when necessary
- Caching results – Store previous analysis results
Common Pitfalls and Solutions
Misinterpreting Cycles
Problem: Assuming all cycles indicate deadlocks in multi-instance scenarios.
Solution: Always verify resource availability before concluding deadlock existence.
Incomplete Graph Construction
Problem: Missing resource instances or process states.
Solution: Implement comprehensive system state tracking and validation.
Performance Degradation
Problem: Frequent RAG analysis causing system slowdown.
Solution: Use event-driven analysis and optimize graph algorithms.
Conclusion
Resource Allocation Graphs provide essential visualization and analysis capabilities for deadlock management in operating systems. By understanding their construction, analysis techniques, and practical applications, system designers can build more robust and efficient computing systems.
The key to successful RAG implementation lies in balancing thorough analysis with performance considerations, ensuring that deadlock detection and prevention mechanisms enhance rather than hinder system operation. As systems become more complex and distributed, RAG concepts continue to evolve, incorporating new techniques for handling modern computing challenges.
Mastering Resource Allocation Graphs empowers developers and system administrators to diagnose, prevent, and resolve deadlock situations effectively, leading to more reliable and responsive computing environments.
Related Posts
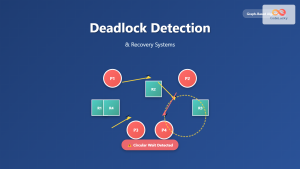
Deadlock Detection and Recovery: Graph-based Algorithms for Operating Systems
Introduction to Deadlock Detection and Recovery Deadlock is one of the most critical challenges in operating systems where multiple processes...
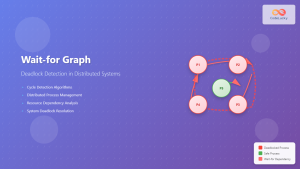
Wait-for Graph: Comprehensive Guide to Deadlock Detection in Distributed Systems
Introduction to Wait-for Graphs In distributed systems, deadlock detection remains one of the most critical challenges for maintaining system reliability...
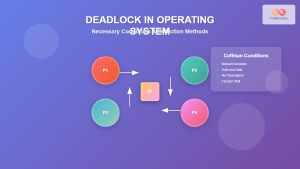
Deadlock in Operating System: Complete Guide to Necessary Conditions and Detection Methods
Deadlock is one of the most critical challenges in operating system design, where multiple processes become permanently blocked while waiting...
Banker’s Algorithm: Complete Guide to Safe State Detection and Resource Allocation
The Banker's Algorithm is a fundamental deadlock avoidance algorithm in operating systems, designed to ensure that resource allocation maintains the...
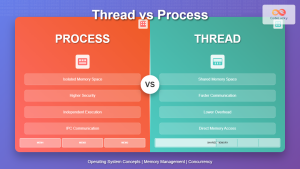
Thread vs Process: Complete Guide to Differences and When to Use Each
Understanding the fundamental differences between threads and processes is crucial for system programming, application design, and performance optimization. While both...
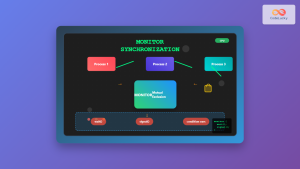
Monitor in Operating System: High-level Synchronization for Process Coordination
What is a Monitor in Operating System? A monitor is a high-level synchronization construct in operating systems that provides a...
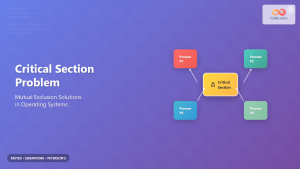
Critical Section Problem: Complete Guide to Mutual Exclusion Solutions in Operating Systems
What is the Critical Section Problem? The critical section problem is a fundamental challenge in operating systems where multiple processes...
Thread Synchronization: Mutexes, Semaphores and Deadlocks in Operating Systems
Introduction to Thread Synchronization Thread synchronization is a fundamental concept in operating systems that ensures multiple threads can safely access...

Deadlock Prevention: Complete Guide to Avoiding Circular Wait Conditions
Understanding Deadlock and Circular Wait Deadlock is one of the most critical issues in operating systems where two or more...
Thread in Operating System: Lightweight Processes and Multithreading Explained
What are Threads in Operating Systems? A thread is the smallest unit of execution within a process that can be...
Process Synchronization: Critical Sections and Race Conditions in Operating Systems
Introduction to Process Synchronization Process synchronization is a fundamental concept in operating systems that ensures multiple processes can safely access...

File Locking Mechanisms: Complete Guide to Advisory and Mandatory Locking in Operating Systems
File locking mechanisms are essential components of modern operating systems that prevent data corruption and ensure data integrity when multiple...