
The ptrace system call is one of Linux’s most powerful tools for process monitoring and debugging. It allows one process to observe and control the execution of another process, making it essential for debuggers, system monitoring tools, and security applications.
What is ptrace?
ptrace (process trace) is a system call that provides a means by which one process (the “tracer”) can observe and control the execution of another process (the “tracee”). It’s the foundation upon which debugging tools like GDB, strace, and ltrace are built.
Key Capabilities
- Read and write process memory
- Read and modify CPU registers
- Control process execution (start, stop, single-step)
- Intercept system calls
- Monitor signal delivery
- Attach to running processes
ptrace System Call Syntax
The ptrace system call has the following signature:
long ptrace(enum __ptrace_request request, pid_t pid, void *addr, void *data);Parameters Explained
| Parameter | Description |
|---|---|
request |
Specifies the operation to perform |
pid |
Process ID of the target process |
addr |
Memory address (context-dependent) |
data |
Data pointer (context-dependent) |
Common ptrace Requests
PTRACE_TRACEME
Indicates that this process should be traced by its parent:
#include <sys/ptrace.h>
#include <stdio.h>
#include <unistd.h>

int main() {
    if (ptrace(PTRACE_TRACEME, 0, NULL, NULL) == -1) {
        perror("ptrace");
        return 1;
    }

    printf("Process ready to be traced\n");
    execl("/bin/ls", "ls", NULL);
    return 0;
}
PTRACE_ATTACH
Attaches to a running process:
#include <sys/ptrace.h>
#include <sys/wait.h>
#include <stdio.h>

int attach_to_process(pid_t pid) {
    if (ptrace(PTRACE_ATTACH, pid, NULL, NULL) == -1) {
        perror("ptrace attach failed");
        return -1;
    }

    int status;
    waitpid(pid, &status, 0);
    printf("Successfully attached to process %d\n", pid);
    return 0;
}
PTRACE_PEEKDATA and PTRACE_POKEDATA
Reading and writing process memory:
#include <sys/ptrace.h>
#include <stdio.h>

// Read memory from traced process
long read_memory(pid_t pid, void *addr) {
    long data = ptrace(PTRACE_PEEKDATA, pid, addr, NULL);
    if (data == -1) {
        perror("ptrace peek failed");
    }
    return data;
}

// Write memory to traced process
int write_memory(pid_t pid, void *addr, long data) {
    if (ptrace(PTRACE_POKEDATA, pid, addr, (void*)data) == -1) {
        perror("ptrace poke failed");
        return -1;
    }
    return 0;
}
Complete Example: Simple Process Tracer
Here’s a comprehensive example that demonstrates process tracing:
#include <sys/ptrace.h>
#include <sys/wait.h>
#include <sys/user.h>
#include <unistd.h>
#include <stdio.h>
#include <stdlib.h>
int main() {
pid_t child;
int status;
struct user_regs_struct regs;
child = fork();
if (child == 0) {
// Child process
ptrace(PTRACE_TRACEME, 0, NULL, NULL);
execl("/bin/ls", "ls", NULL);
} else {
// Parent process (tracer)
wait(&status);
while (WIFSTOPPED(status)) {
// Get system call number
ptrace(PTRACE_GETREGS, child, NULL, ®s);
printf("System call: %lld\n", regs.orig_rax);
// Continue execution
ptrace(PTRACE_SYSCALL, child, NULL, NULL);
wait(&status);
}
printf("Child process finished\n");
}
return 0;
}Expected Output
System call: 59
System call: 12
System call: 21
System call: 9
System call: 3
System call: 3
System call: 3
System call: 3
...
Child process finished
Advanced ptrace Operations
Single Stepping
Execute one instruction at a time:
// Enable single stepping
ptrace(PTRACE_SINGLESTEP, pid, NULL, NULL);
wait(&status);
// Get instruction pointer
struct user_regs_struct regs;
ptrace(PTRACE_GETREGS, pid, NULL, ®s);
printf("Current instruction pointer: 0x%llx\n", regs.rip);System Call Interception
#include <sys/ptrace.h>
#include <sys/wait.h>
#include <sys/user.h>
#include <stdio.h>
#include <unistd.h>
void trace_syscalls(pid_t pid) {
int status;
struct user_regs_struct regs;
int syscall_entry = 1;
while (1) {
wait(&status);
if (WIFEXITED(status)) break;
if (WIFSTOPPED(status)) {
ptrace(PTRACE_GETREGS, pid, NULL, ®s);
if (syscall_entry) {
printf("Entering syscall %lld\n", regs.orig_rax);
} else {
printf("Exiting syscall, return value: %lld\n", regs.rax);
}
syscall_entry = !syscall_entry;
ptrace(PTRACE_SYSCALL, pid, NULL, NULL);
}
}
}Working with Registers
Reading CPU Registers
#include <sys/user.h>
void print_registers(pid_t pid) {
struct user_regs_struct regs;
if (ptrace(PTRACE_GETREGS, pid, NULL, ®s) == 0) {
printf("RAX: 0x%llx\n", regs.rax);
printf("RBX: 0x%llx\n", regs.rbx);
printf("RCX: 0x%llx\n", regs.rcx);
printf("RDX: 0x%llx\n", regs.rdx);
printf("RSI: 0x%llx\n", regs.rsi);
printf("RDI: 0x%llx\n", regs.rdi);
printf("RIP: 0x%llx\n", regs.rip);
printf("RSP: 0x%llx\n", regs.rsp);
}
}Modifying Registers
void modify_register(pid_t pid) {
struct user_regs_struct regs;
// Get current registers
ptrace(PTRACE_GETREGS, pid, NULL, ®s);
// Modify a register (example: change RAX)
regs.rax = 0x12345678;
// Set modified registers
ptrace(PTRACE_SETREGS, pid, NULL, ®s);
printf("Modified RAX register\n");
}Error Handling and Best Practices
Proper Error Checking
#include <errno.h>
#include <string.h>

int safe_ptrace(int request, pid_t pid, void *addr, void *data) {
    errno = 0;
    long result = ptrace(request, pid, addr, data);

    if (result == -1 && errno != 0) {
        fprintf(stderr, "ptrace error: %s\n", strerror(errno));
        return -1;
    }

    return 0;
}
Process Cleanup
void cleanup_traced_process(pid_t pid) {
    // Detach from process
    if (ptrace(PTRACE_DETACH, pid, NULL, NULL) == -1) {
        perror("ptrace detach failed");
    }

    printf("Successfully detached from process %d\n", pid);
}
Security Considerations
Permission Requirements
- Same User ID: Can trace processes owned by the same user
- Root Privileges: Required to trace processes owned by other users
- Parent-Child Relationship: Parents can trace their children without special privileges
Security Restrictions
// Check if process can be traced
int check_traceable(pid_t pid) {
    char path[256];
    FILE *fp;

    snprintf(path, sizeof(path), "/proc/%d/status", pid);
    fp = fopen(path, "r");

    if (!fp) {
        perror("Cannot access process status");
        return 0;
    }

    // Check TracerPid field in /proc/pid/status
    // Implementation depends on specific requirements

    fclose(fp);
    return 1;
}
Debugging with ptrace
Breakpoint Implementation
#include <sys/ptrace.h>

// Set a software breakpoint
int set_breakpoint(pid_t pid, void *addr) {
    // Read original instruction
    long original = ptrace(PTRACE_PEEKDATA, pid, addr, NULL);
    if (original == -1) {
        perror("Failed to read memory");
        return -1;
    }

    // Insert INT 3 instruction (0xCC)
    long breakpoint = (original & ~0xFF) | 0xCC;

    if (ptrace(PTRACE_POKEDATA, pid, addr, (void*)breakpoint) == -1) {
        perror("Failed to set breakpoint");
        return -1;
    }

    printf("Breakpoint set at address %p\n", addr);
    return 0;
}
Common Use Cases
1. System Call Monitoring
Monitor system calls made by a process:
./syscall_tracer target_program2. Memory Analysis
Analyze process memory layout and contents:
// Read process memory regions
void analyze_memory(pid_t pid, void *start_addr, size_t size) {
    for (size_t i = 0; i < size; i += sizeof(long)) {
        long data = ptrace(PTRACE_PEEKDATA, pid, start_addr + i, NULL);
        printf("Address %p: 0x%lx\n", start_addr + i, data);
    }
}
3. Dynamic Analysis
Analyze program behavior during runtime:
- Function call tracing
- Variable monitoring
- Control flow analysis
- Performance profiling
Limitations and Alternatives
ptrace Limitations
- Performance Impact: Significant overhead due to context switches
- Single Tracer: Only one process can trace another at a time
- Platform Specific: Implementation varies across different architectures
- Security Restrictions: Limited by kernel security policies
Alternative Tools
| Tool | Purpose | Advantages |
|---|---|---|
| strace | System call tracing | Ready-to-use, comprehensive output |
| ltrace | Library call tracing | Focuses on library functions |
| GDB | Debugging | Full-featured debugger interface |
| perf | Performance analysis | Lower overhead, statistical sampling |
Troubleshooting Common Issues
Permission Denied Errors
// Check process permissions
if (ptrace(PTRACE_ATTACH, pid, NULL, NULL) == -1) {
    if (errno == EPERM) {
        printf("Permission denied. Try running as root or check process ownership.\n");
    } else if (errno == ESRCH) {
        printf("Process not found or already being traced.\n");
    }
}
Process State Issues
- Zombie Processes: Cannot be traced
- Kernel Threads: Generally not traceable
- Already Traced: Only one tracer allowed per process
Conclusion
The ptrace system call is a powerful tool for process monitoring, debugging, and analysis in Linux systems. While it requires careful handling and has performance implications, it provides unparalleled access to process internals. Understanding ptrace is essential for system programmers, security researchers, and anyone working with low-level process analysis.
Remember to always handle ptrace operations with proper error checking, respect security boundaries, and consider the performance impact when using it in production environments. For most common debugging tasks, higher-level tools like GDB or strace might be more appropriate, but ptrace remains the fundamental building block that makes these tools possible.
Related Posts
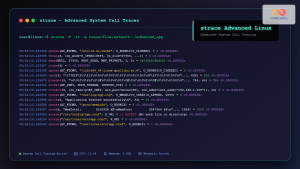
strace Advanced Linux: Complete Guide to System Call Tracing and Debugging
strace is one of the most powerful debugging and diagnostic tools available in Linux systems. It allows you to trace...
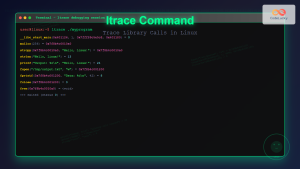
ltrace Command Linux: Complete Guide to Trace Library Calls and Debug Programs
The ltrace command is a powerful debugging and analysis tool in Linux that allows you to trace library calls made...
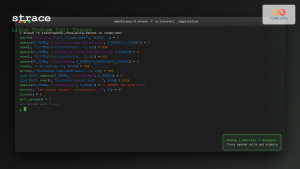
strace Command Linux: Complete Guide to System Call Tracing and Debugging
The strace command is one of the most powerful debugging and monitoring tools available in Linux systems. It allows you...
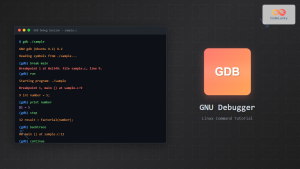
gdb Command Linux: Complete GNU Debugger Tutorial for Developers
The GNU Debugger (GDB) is one of the most powerful and essential tools for developers working on Linux systems. As...
valgrind Command Linux: Complete Memory Debugging and Profiling Guide
Valgrind is one of the most powerful and essential tools for Linux developers and system administrators who need to debug...
gcore Command Linux: Complete Guide to Generate Core Dump Files for Debugging
The gcore command in Linux is a powerful debugging tool that generates core dump files from running processes without terminating...
perf Command Linux: Complete Performance Analysis and Profiling Guide
The perf command is one of the most powerful performance analysis tools available in Linux, offering comprehensive insights into system...
Process in Operating System: Complete Guide to Definition, States and Lifecycle
What is a Process in Operating System? A process is a program in execution that consists of the program code...
htop Command Linux: Complete Guide to Advanced Process Monitoring and Management
The htop command is an enhanced, interactive version of the traditional top command that provides real-time monitoring of system processes...
ps Command in Linux: Complete Guide to Process Monitoring and Management
The ps command is one of the most fundamental and powerful tools in Linux for displaying information about running processes....

C Debugging: Using GDB for Troubleshooting
Debugging is an essential skill for any C programmer. It's the process of finding and fixing errors in your code,...
Core Dump Linux: Complete Guide to Debug Program Crashes and Memory Issues
A core dump is a crucial debugging tool in Linux that captures the complete memory state of a program at...


