
The gcore command in Linux is a powerful debugging tool that generates core dump files from running processes without terminating them. This utility is essential for system administrators and developers who need to analyze application behavior, debug issues, or capture process state for later examination.
What is gcore Command?
The gcore command creates a core dump file of a specified process while it continues running. Unlike traditional core dumps that occur when a program crashes, gcore allows you to capture the memory state of a healthy, running process for analysis purposes.
Core dumps contain the memory image of a process at a specific point in time, including:
- Process memory contents
- Register states
- Stack traces
- Loaded libraries
- File descriptors
Basic Syntax
gcore [options] pid [pid2 pid3 ...]Where pid is the process ID of the target process you want to dump.
Common Options and Parameters
| Option | Description |
|---|---|
-a |
Dump all processes with the same name |
-o filename |
Specify output filename prefix |
-c |
Create core file with specific naming |
-s |
Stop the process during dump creation |
Installation and Availability
The gcore command is typically part of the GDB (GNU Debugger) package. To install it:
Ubuntu/Debian:
sudo apt update
sudo apt install gdb
CentOS/RHEL/Fedora:
sudo yum install gdb
# or for newer versions
sudo dnf install gdb
Practical Examples
Example 1: Basic Core Dump Generation
First, let’s identify a running process and generate its core dump:
# Find a process ID
ps aux | grep firefox
# Output example:
user    1234  0.5  2.1 2834567 234567 ?  Sl  09:30  0:15 /usr/bin/firefox

# Generate core dump
sudo gcore 1234
Expected Output:
Saved corefile core.1234Example 2: Custom Output Filename
# Generate core dump with custom filename
sudo gcore -o firefox_debug 1234
Expected Output:
Saved corefile firefox_debug.1234Example 3: Multiple Process Dump
# Dump multiple processes
sudo gcore 1234 5678 9101
Expected Output:
Saved corefile core.1234
Saved corefile core.5678
Saved corefile core.9101
Example 4: Dump All Processes with Same Name
# Find all processes with same name
pgrep httpd
# Output: 1234 5678 9101

# Dump all httpd processes
sudo gcore -a httpd
Advanced Usage Scenarios
Debugging Memory Leaks
For applications with suspected memory leaks, you can generate periodic core dumps:
#!/bin/bash
# Script to generate periodic core dumps
PID=$1
INTERVAL=$2
COUNT=$3

for i in $(seq 1 $COUNT); do
    echo "Generating core dump $i at $(date)"
    sudo gcore -o memleak_$i $PID
    sleep $INTERVAL
done
Production Environment Debugging
# Generate core dump without stopping the service
sudo gcore -o production_debug $(pgrep nginx | head -1)
Analyzing Core Dump Files
Once you have generated a core dump, you can analyze it using GDB:
# Load core dump in GDB
gdb /path/to/binary core.1234

# Common GDB commands for analysis
(gdb) bt              # Show backtrace
(gdb) info registers  # Show register values
(gdb) info threads    # Show all threads
(gdb) print variable  # Print variable value
Core Dump File Management
Checking Core Dump Size
# Check size before generating
ls -lh core.*
# Output example:
-rw------- 1 root root 45M Aug 25 09:30 core.1234
Compressing Core Dumps
# Compress large core dumps
gzip core.1234
# Result: core.1234.gz
Troubleshooting Common Issues
Permission Denied Errors
If you encounter permission errors:
# Check process ownership
ps -o pid,user,cmd -p 1234

# Use sudo for root-owned processes
sudo gcore 1234
Large Core Dump Files
For processes with large memory footprints:
# Check available disk space
df -h /tmp

# Set core dump size limits
ulimit -c unlimited
Process Not Found
# Verify process is still running
ps -p 1234
# If empty output, process has terminated
Security Considerations
Core dump files may contain sensitive information:
- Passwords: May be present in memory
- Encryption keys: Could be exposed in dumps
- Personal data: User information might be included
Best practices for security:
# Set restrictive permissions
chmod 600 core.*

# Store in secure location
mv core.* /secure/debug/location/

# Clean up after analysis
rm -f core.* when done
Integration with Debugging Workflows
Automated Core Dump Collection
#!/bin/bash
# Automated debugging script
SERVICE_NAME="myapp"
DEBUG_DIR="/var/debug"

# Create debug directory
mkdir -p $DEBUG_DIR

# Find service PID
PID=$(pgrep $SERVICE_NAME)

if [ -n "$PID" ]; then
    echo "Generating core dump for $SERVICE_NAME (PID: $PID)"
    sudo gcore -o $DEBUG_DIR/${SERVICE_NAME}_$(date +%Y%m%d_%H%M%S) $PID
    echo "Core dump saved to $DEBUG_DIR"
else
    echo "Service $SERVICE_NAME not running"
fi
Performance Impact
The gcore command can temporarily impact system performance:
- Memory usage: Additional memory required during dump
- I/O operations: Disk writes for large core files
- Process pause: Brief interruption of target process
Minimizing Impact
# Generate core dump during low-traffic periods
sudo gcore -o debug_$(date +%H%M) $PID

# Monitor system resources during dump
iostat -x 1 & sudo gcore $PID; killall iostat
Best Practices
- Test in development: Practice core dump analysis before production issues
- Document procedures: Create runbooks for debugging scenarios
- Regular cleanup: Remove old core dumps to free disk space
- Secure storage: Protect core dumps containing sensitive data
- Version tracking: Include binary version info with core dumps
Alternative Tools
While gcore is powerful, consider these alternatives:
- kill -QUIT: Generate core dump by sending signal
- gdb attach: Attach debugger directly to running process
- perf: Performance analysis and profiling
- strace: System call tracing
Conclusion
The gcore command is an essential tool for Linux system administrators and developers. It provides a non-destructive way to capture process state for debugging purposes, enabling thorough analysis of application behavior without service interruption. By mastering gcore usage, you can significantly improve your debugging capabilities and system troubleshooting efficiency.
Remember to always consider security implications when working with core dumps, especially in production environments. Regular practice with gcore and related debugging tools will enhance your ability to quickly diagnose and resolve complex system issues.
Related Posts
Core Dump Linux: Complete Guide to Debug Program Crashes and Memory Issues
A core dump is a crucial debugging tool in Linux that captures the complete memory state of a program at...
gdb Command Linux: Complete GNU Debugger Tutorial for Developers
The GNU Debugger (GDB) is one of the most powerful and essential tools for developers working on Linux systems. As...
valgrind Command Linux: Complete Memory Debugging and Profiling Guide
Valgrind is one of the most powerful and essential tools for Linux developers and system administrators who need to debug...
ptrace Command Linux: Complete Guide to Process Tracing System Call
The ptrace system call is one of Linux's most powerful tools for process monitoring and debugging. It allows one process...

C Debugging: Using GDB for Troubleshooting
Debugging is an essential skill for any C programmer. It's the process of finding and fixing errors in your code,...
strace Advanced Linux: Complete Guide to System Call Tracing and Debugging
strace is one of the most powerful debugging and diagnostic tools available in Linux systems. It allows you to trace...
strace Command Linux: Complete Guide to System Call Tracing and Debugging
The strace command is one of the most powerful debugging and monitoring tools available in Linux systems. It allows you...
ltrace Command Linux: Complete Guide to Trace Library Calls and Debug Programs
The ltrace command is a powerful debugging and analysis tool in Linux that allows you to trace library calls made...
debugfs Command Linux: Complete Guide to Debug Ext2/3/4 Filesystems
The debugfs command is a powerful interactive filesystem debugger for ext2, ext3, and ext4 filesystems in Linux. It provides low-level...
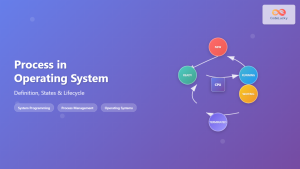
Process in Operating System: Complete Guide to Definition, States and Lifecycle
What is a Process in Operating System? A process is a program in execution that consists of the program code...
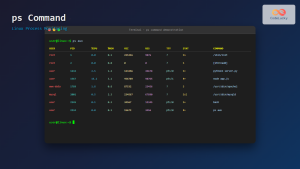
ps Command in Linux: Complete Guide to Process Monitoring and Management
The ps command is one of the most fundamental and powerful tools in Linux for displaying information about running processes....
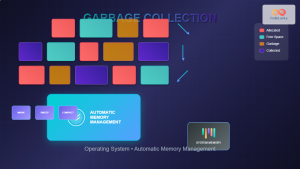
Garbage Collection in Operating System: Complete Guide to Automatic Memory Management
What is Garbage Collection in Operating Systems? Garbage collection is an automatic memory management technique used by operating systems and...
- What is gcore Command?
- Basic Syntax
- Common Options and Parameters
- Installation and Availability
- Practical Examples
- Advanced Usage Scenarios
- Analyzing Core Dump Files
- Core Dump File Management
- Troubleshooting Common Issues
- Security Considerations
- Integration with Debugging Workflows
- Performance Impact
- Best Practices
- Alternative Tools
- Conclusion


