
The Excel VAR function is a powerful statistical tool that calculates the variance of a sample dataset, helping you measure how spread out your data points are from the mean. Understanding variance is crucial for data analysis, quality control, and making informed business decisions based on data variability.
What is the VAR Function in Excel?
The VAR function in Excel calculates the sample variance of a dataset by measuring the average squared deviation from the mean. This function assumes your data represents a sample of a larger population, making it ideal for statistical analysis where you’re working with partial data rather than complete population data.
Variance helps you understand data consistency and reliability. A low variance indicates data points are close to the mean, while high variance suggests greater spread and variability in your dataset.
VAR Function Syntax
Basic Syntax:
=VAR(number1, [number2], ...)
Parameters:
- number1 (required): The first number, cell reference, or range containing numerical values
- number2, … (optional): Additional numbers, cell references, or ranges (up to 255 arguments)
How VAR Function Works
The VAR function performs these calculations internally:
- Calculates the arithmetic mean (average) of all values
- Finds the difference between each value and the mean
- Squares each difference to eliminate negative values
- Sums all squared differences
- Divides by (n-1) where n is the number of data points
The mathematical formula is: VAR = Σ(xi – x̄)² / (n-1)
Basic VAR Function Examples
Example 1: Simple Number List
Calculate variance for values: 10, 15, 20, 25, 30
=VAR(10,15,20,25,30)
Result: 62.5
Example 2: Cell Range
If your data is in cells A1:A10:
=VAR(A1:A10)
Example 3: Multiple Ranges
Combine data from different ranges:
=VAR(A1:A5,C1:C5,E1:E3)
Real-World Applications
Sales Performance Analysis
Analyze monthly sales variance to understand performance consistency:
| Month | Sales ($) |
|---|---|
| Jan | 25000 |
| Feb | 28000 |
| Mar | 22000 |
| Apr | 30000 |
| May | 26000 |
Formula: =VAR(B2:B6)
Result: 10,000,000 (indicating moderate sales variability)
Quality Control Testing
Monitor product weight consistency in manufacturing:
=VAR(D2:D50)
Lower variance indicates better quality control and consistency.
Advanced VAR Function Techniques
Conditional Variance with SUMPRODUCT
Calculate variance for specific criteria using array formulas:
=VAR(IF(A2:A20="Product A",B2:B20))
Note: Enter as array formula with Ctrl+Shift+Enter in older Excel versions
Dynamic Range with OFFSET
Create flexible variance calculations:
=VAR(OFFSET(A1,0,0,COUNTA(A:A),1))
Excluding Outliers
Calculate variance while excluding extreme values:
=VAR(IF(ABS(A2:A20-AVERAGE(A2:A20))<=2*STDEV(A2:A20),A2:A20))
VAR vs Other Variance Functions
VAR vs VAR.S
VAR and VAR.S are identical functions. VAR.S was introduced in Excel 2010 for clarity, indicating "sample variance."
VAR vs VAR.P
- VAR (VAR.S): Sample variance, divides by (n-1)
- VAR.P: Population variance, divides by (n)
Use VAR when analyzing a sample; use VAR.P when working with complete population data.
VAR vs STDEV
- VAR: Returns variance (squared units)
- STDEV: Returns standard deviation (original units)
Relationship: STDEV = √VAR
Common VAR Function Errors
#DIV/0! Error
Cause: Less than two numerical values in the dataset
Solution: Ensure at least two numbers for variance calculation
#VALUE! Error
Cause: Non-numerical values in the range
Solution: Remove text or use functions that handle mixed data types
#N/A Error
Cause: Empty cells or invalid references
Solution: Check cell references and data validity
Best Practices for VAR Function
Data Preparation
- Clean your data by removing outliers that might skew results
- Ensure consistent data types (all numbers)
- Handle missing values appropriately
- Verify data accuracy before analysis
Performance Optimization
- Use specific ranges instead of entire columns
- Avoid volatile functions within VAR calculations
- Consider using VAR.S for clarity in newer Excel versions
- Cache results for frequently used variance calculations
Documentation and Validation
- Document your variance calculations with clear labels
- Cross-validate results using alternative calculation methods
- Include units and context for variance interpretations
- Test with known datasets to verify accuracy
Practical Variance Analysis Tips
Interpreting Variance Results
Variance values are always positive and in squared units of your original data. For practical interpretation:
- Compare variance relative to the mean
- Use coefficient of variation (CV = STDEV/MEAN) for standardized comparison
- Consider industry benchmarks for context
- Track variance trends over time
Combining with Other Functions
Enhance your analysis by combining VAR with complementary functions:
=VAR(A1:A10) & " (CV: " & STDEV(A1:A10)/AVERAGE(A1:A10)*100 & "%)"
Troubleshooting VAR Function Issues
Unexpected Results
If your VAR function returns unexpected values:
- Verify data range accuracy
- Check for hidden characters or spaces
- Ensure number formatting is correct
- Validate calculation method (sample vs population)
Performance Issues
For large datasets causing slow calculations:
- Use structured references in Excel tables
- Consider breaking large datasets into smaller chunks
- Implement efficient data structures
- Use array formulas judiciously
Conclusion
The Excel VAR function is an essential tool for statistical analysis, providing valuable insights into data variability and consistency. Whether you're analyzing sales performance, monitoring quality control, or conducting research, understanding how to properly use VAR will enhance your data analysis capabilities.
Remember to choose the appropriate variance function (VAR for samples, VAR.P for populations), prepare your data carefully, and interpret results in context. With practice, the VAR function becomes an invaluable component of your Excel statistical toolkit, enabling more informed decision-making based on data-driven insights.
Master these concepts and techniques to leverage Excel's VAR function effectively in your data analysis projects, improving the accuracy and reliability of your statistical calculations.
Related Posts

Excel VARP Function: Complete Guide to Population Variance Calculations
The VARP function in Microsoft Excel is a powerful statistical tool that calculates the population variance of a dataset. Understanding...
Excel COVAR Function: Complete Guide to Covariance Calculation with Examples
What is the Excel COVAR Function? The Excel COVAR function calculates the covariance between two datasets, measuring how two variables...

Excel STDEV Function: Complete Guide to Standard Deviation Calculations
The STDEV function in Excel is a powerful statistical tool that calculates the standard deviation of a sample dataset. Understanding...

Excel COUNT Function: Complete Guide to Number Counting Formulas
The COUNT function is one of Excel's most fundamental and frequently used statistical functions. Whether you're analyzing sales data, tracking...
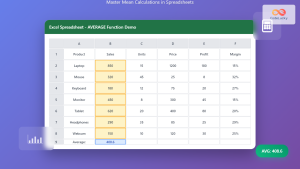
Excel AVERAGE Function: Complete Guide to Mean Calculation with Syntax Examples
The Excel AVERAGE function is one of the most fundamental and widely-used statistical functions in Microsoft Excel. This powerful function...

Excel TYPE Function: Complete Guide to Data Type Detection and Validation
The Excel TYPE function is a powerful information function that identifies the data type of a value in a cell...
Excel SUM Function: Complete Guide to Addition Formulas and Advanced Techniques
The Excel SUM function is one of the most fundamental and widely-used formulas in Microsoft Excel, designed to add numerical...
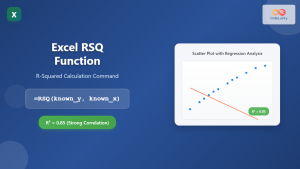
Excel RSQ Function: Complete Guide to R-Squared Calculations in Excel
What is the Excel RSQ Function? The RSQ function in Microsoft Excel calculates the square of the Pearson product-moment correlation...
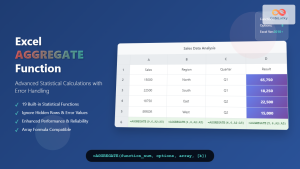
Excel AGGREGATE Function: Complete Guide to Advanced Statistical Calculations
Excel's AGGREGATE function is one of the most powerful and versatile statistical functions available in Microsoft Excel. Unlike traditional statistical...

Excel MIN Function: Complete Guide to Finding Minimum Values with Formula Examples
The MIN function in Microsoft Excel is one of the most fundamental and frequently used statistical functions for data analysis....

Excel CELL Function: Complete Guide to Cell Information Formula Syntax
The CELL function in Microsoft Excel is a powerful information function that returns specific details about the formatting, location, or...

Excel ROWS Function: Complete Guide to Count Rows with Formula Syntax Examples
What is the Excel ROWS Function? The ROWS function in Microsoft Excel is a built-in lookup and reference function that...


