
The VARP function in Microsoft Excel is a powerful statistical tool that calculates the population variance of a dataset. Understanding how to use VARP effectively can significantly enhance your data analysis capabilities and help you make more informed decisions based on statistical insights.
What is the VARP Function?
VARP stands for “Variance Population” and is designed to calculate the variance of an entire population dataset. Variance measures how spread out data points are from the mean (average) value. The VARP function assumes that your data represents the complete population rather than just a sample.
Population variance is calculated using the formula:
σ² = Σ(x – μ)² / N
Where:
- σ² represents population variance
- x represents each data point
- μ represents the population mean
- N represents the total number of data points
VARP Function Syntax
The syntax for the VARP function is straightforward:
=VARP(number1, [number2], [number3], ...)
Parameters Explained:
- number1 (required): The first number, cell reference, or range containing numerical values
- number2, number3, … (optional): Additional numbers, cell references, or ranges up to 255 arguments
Key Features and Limitations
What VARP Accepts:
- Numerical values (integers and decimals)
- Cell references containing numbers
- Named ranges with numerical data
- Arrays of numbers
What VARP Ignores:
- Text values
- Logical values (TRUE/FALSE)
- Empty cells
- Error values
Important Limitations:
- Requires at least one numerical value
- Maximum of 255 arguments
- Cannot handle more than 1,048,576 data points in a single range
Step-by-Step Examples
Example 1: Basic VARP Calculation
Let’s calculate the population variance for a simple dataset:
| Cell | Value |
|---|---|
| A1 | 10 |
| A2 | 15 |
| A3 | 20 |
| A4 | 25 |
| A5 | 30 |
Formula: =VARP(A1:A5)
Result: 50
Example 2: Using Multiple Arguments
You can also pass individual values or multiple ranges:
Formula: =VARP(10, 15, 20, 25, 30)
Result: 50
Example 3: Real-World Sales Data
Consider monthly sales data for a complete year:
| Month | Sales ($) |
|---|---|
| Jan | 45000 |
| Feb | 52000 |
| Mar | 48000 |
| Apr | 55000 |
| May | 61000 |
| Jun | 58000 |
Formula: =VARP(B2:B7)
This calculates how much the monthly sales vary from the average.
VARP vs VAR.P vs VAR.S
Understanding the differences between variance functions is crucial:
| Function | Purpose | Denominator | Use Case |
|---|---|---|---|
| VARP | Population variance (legacy) | N | Complete population data |
| VAR.P | Population variance (current) | N | Complete population data |
| VAR.S | Sample variance | N-1 | Sample data representing larger population |
When to Use VARP
Use the VARP function when:
- Complete Population Data: You have data for the entire population, not just a sample
- Quality Control: Measuring consistency in manufacturing processes
- Performance Analysis: Analyzing variability in complete datasets
- Risk Assessment: Calculating variance for known, complete risk factors
- Legacy Compatibility: Working with older Excel versions or existing formulas
Common Errors and Troubleshooting
#DIV/0! Error
Cause: No numerical values in the specified range
Solution: Ensure your range contains at least one number
#VALUE! Error
Cause: Invalid arguments or array formulas issues
Solution: Check that all arguments are valid cell references or numbers
#NAME? Error
Cause: Typo in function name or invalid range references
Solution: Verify spelling and range references
Advanced Tips and Best Practices
1. Data Preparation
Always clean your data before calculating variance:
- Remove or handle outliers appropriately
- Ensure consistent data types
- Verify that empty cells don’t affect your analysis
2. Combining with Other Functions
Create more powerful analyses by combining VARP with other statistical functions:
Coefficient of Variation:
=SQRT(VARP(A1:A10))/AVERAGE(A1:A10)
Standard Deviation:
=SQRT(VARP(A1:A10))
3. Dynamic Ranges
Use dynamic ranges for flexible analysis:
=VARP(OFFSET(A1,0,0,COUNTA(A:A),1))
Practical Applications
Business Intelligence
Use VARP to measure consistency in:
- Sales performance across regions
- Production quality metrics
- Customer satisfaction scores
- Employee performance ratings
Financial Analysis
Apply VARP for:
- Portfolio risk assessment
- Revenue volatility analysis
- Budget variance reporting
- Cost control monitoring
Performance Considerations
For large datasets, consider these optimization strategies:
- Use contiguous ranges:
=VARP(A1:A1000)is faster than multiple separate ranges - Avoid volatile functions: Don’t combine VARP with functions like NOW() or RAND()
- Consider array formulas: For complex conditions, array formulas might be more efficient
Alternative Approaches
Manual Calculation
For educational purposes or verification, you can calculate population variance manually:
- Calculate the mean:
=AVERAGE(A1:A10) - Calculate squared differences:
=(A1-$B$1)^2 - Sum squared differences:
=SUM(C1:C10) - Divide by population size:
=D1/COUNT(A1:A10)
Conclusion
The VARP function is an essential tool for statistical analysis in Excel, particularly when working with complete population datasets. By understanding its syntax, limitations, and best practices, you can effectively measure data variability and make informed decisions based on statistical insights.
Remember to choose the appropriate variance function based on whether you’re working with a complete population (VARP or VAR.P) or a sample (VAR.S). With proper implementation, VARP can significantly enhance your data analysis capabilities and provide valuable insights into data consistency and variability patterns.
Whether you’re analyzing business metrics, conducting quality control assessments, or performing financial analysis, mastering the VARP function will improve your ability to understand and communicate data variability effectively.
Related Posts

Excel VAR Function: Complete Guide to Variance Calculations in Spreadsheets
The Excel VAR function is a powerful statistical tool that calculates the variance of a sample dataset, helping you measure...

Excel STDEVP Function: Complete Guide to Population Standard Deviation
The STDEVP function in Microsoft Excel is a powerful statistical tool that calculates the population standard deviation of a dataset....

Excel STDEV Function: Complete Guide to Standard Deviation Calculations
The STDEV function in Excel is a powerful statistical tool that calculates the standard deviation of a sample dataset. Understanding...
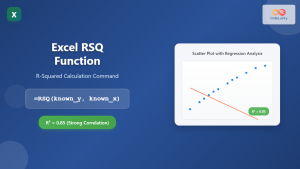
Excel RSQ Function: Complete Guide to R-Squared Calculations in Excel
What is the Excel RSQ Function? The RSQ function in Microsoft Excel calculates the square of the Pearson product-moment correlation...

Excel EXP Function: Complete Guide to Exponential Calculations
What is the Excel EXP Function? The Excel EXP function is a powerful mathematical function that calculates the exponential value...
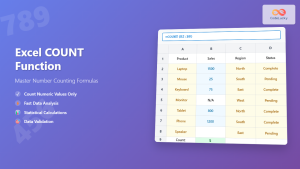
Excel COUNT Function: Complete Guide to Number Counting Formulas
The COUNT function is one of Excel's most fundamental and frequently used statistical functions. Whether you're analyzing sales data, tracking...
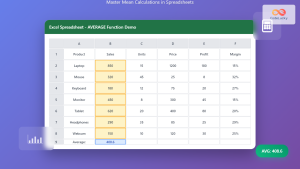
Excel AVERAGE Function: Complete Guide to Mean Calculation with Syntax Examples
The Excel AVERAGE function is one of the most fundamental and widely-used statistical functions in Microsoft Excel. This powerful function...

Excel AVERAGEIF Function: Complete Guide to Conditional Average Formulas
What is the Excel AVERAGEIF Function? The AVERAGEIF function is one of Excel's most powerful statistical tools that calculates the...

Excel SUMIF Function: Complete Guide to Conditional Sum Formulas with Syntax Examples
What is the Excel SUMIF Function? The SUMIF function is one of Excel's most powerful conditional sum formulas that allows...
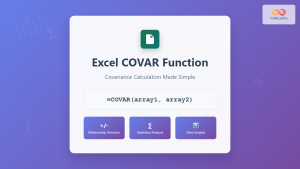
Excel COVAR Function: Complete Guide to Covariance Calculation with Examples
What is the Excel COVAR Function? The Excel COVAR function calculates the covariance between two datasets, measuring how two variables...

Excel GROWTH Function: Complete Guide to Exponential Growth Calculations
The Excel GROWTH function is a powerful statistical tool that calculates exponential growth by fitting data to an exponential curve....

Excel PERCENTILE Function: Complete Guide to Statistical Analysis and Ranking
The Excel PERCENTILE function is a powerful statistical tool that helps you analyze data distribution and identify specific values within...


