
The Excel SUBTOTAL function is one of the most powerful yet underutilized functions in Microsoft Excel. Unlike standard aggregation functions like SUM or AVERAGE, SUBTOTAL intelligently works with filtered data, making it essential for dynamic data analysis and reporting.
What is the Excel SUBTOTAL Function?
The SUBTOTAL function performs calculations on a range of cells while automatically ignoring hidden or filtered rows. This unique behavior makes it perfect for creating dynamic reports that update automatically when you apply filters to your data.
When you filter data in Excel, regular functions like SUM continue to calculate values from hidden rows. However, SUBTOTAL only processes visible cells, providing accurate results for your filtered dataset.
SUBTOTAL Function Syntax
The basic syntax for the SUBTOTAL function is:
=SUBTOTAL(function_num, ref1, [ref2], ...)Parameters:
- function_num: A number from 1-11 or 101-111 that specifies which function to use
- ref1: The first range or reference for calculation
- ref2: (Optional) Additional ranges or references
SUBTOTAL Function Numbers and Their Meanings
The function_num parameter determines which calculation SUBTOTAL performs. Excel provides two sets of function numbers:
Standard Function Numbers (1-11)
These numbers include manually hidden rows in calculations:
| Function Number | Function | Description |
|---|---|---|
| 1 | AVERAGE | Calculates the average of values |
| 2 | COUNT | Counts cells containing numbers |
| 3 | COUNTA | Counts non-empty cells |
| 4 | MAX | Returns the maximum value |
| 5 | MIN | Returns the minimum value |
| 6 | PRODUCT | Multiplies all values together |
| 7 | STDEV | Calculates standard deviation (sample) |
| 8 | STDEVP | Calculates standard deviation (population) |
| 9 | SUM | Adds all values together |
| 10 | VAR | Calculates variance (sample) |
| 11 | VARP | Calculates variance (population) |
Ignore Hidden Rows Function Numbers (101-111)
These numbers exclude both filtered and manually hidden rows:
| Function Number | Function | Behavior |
|---|---|---|
| 101 | AVERAGE | Ignores all hidden rows |
| 102 | COUNT | Ignores all hidden rows |
| 103 | COUNTA | Ignores all hidden rows |
| 104 | MAX | Ignores all hidden rows |
| 105 | MIN | Ignores all hidden rows |
| 106 | PRODUCT | Ignores all hidden rows |
| 107 | STDEV | Ignores all hidden rows |
| 108 | STDEVP | Ignores all hidden rows |
| 109 | SUM | Ignores all hidden rows |
| 110 | VAR | Ignores all hidden rows |
| 111 | VARP | Ignores all hidden rows |
Practical Examples of SUBTOTAL Function
Example 1: Basic Sales Data Calculation
Imagine you have a sales dataset with the following structure:
| Product | Sales Amount | Region |
|---|---|---|
| Laptop | 1200 | North |
| Mouse | 25 | South |
| Keyboard | 75 | North |
| Monitor | 300 | East |
To calculate the total sales for visible rows, use:
=SUBTOTAL(9, B2:B5)This formula will automatically adjust when you filter the data by region or any other criteria.
Example 2: Dynamic Average Calculation
To calculate the average of visible sales amounts:
=SUBTOTAL(1, B2:B5)This formula provides the average of only the visible (filtered) data, updating automatically as you change filters.
Example 3: Counting Visible Entries
To count how many visible entries contain data:
=SUBTOTAL(3, A2:A5)This counts non-empty cells in the visible range, perfect for determining how many records meet your filter criteria.
Advanced SUBTOTAL Techniques
Multiple Range References
SUBTOTAL can work with multiple ranges simultaneously:
=SUBTOTAL(9, B2:B5, D2:D5, F2:F5)This sums values from three different columns, considering only visible rows across all ranges.
Nested SUBTOTAL Functions
You can combine SUBTOTAL with other functions for complex calculations:
=SUBTOTAL(9, B2:B10) / SUBTOTAL(2, B2:B10)This calculates the average by dividing the sum by the count of visible numeric values.
Using SUBTOTAL with Tables
When working with Excel Tables, SUBTOTAL becomes even more powerful:
=SUBTOTAL(9, Table1[Sales])This formula automatically adjusts as your table grows or shrinks, and respects any filters applied to the table.
SUBTOTAL vs Other Excel Functions
SUBTOTAL vs SUM
- SUM: Calculates all values regardless of visibility
- SUBTOTAL: Only calculates visible values in filtered data
SUBTOTAL vs AGGREGATE
- SUBTOTAL: Limited to 11 basic functions, simpler syntax
- AGGREGATE: Offers 19 functions with more options for handling errors
When to Use SUBTOTAL
Choose SUBTOTAL when you need:
- Dynamic calculations that respond to filters
- Simple aggregation functions on visible data
- Compatibility with older Excel versions
- Straightforward syntax without complex error handling
Common SUBTOTAL Function Errors and Solutions
#VALUE! Error
Cause: Invalid function number or non-numeric data in calculation range
Solution: Verify function numbers (1-11 or 101-111) and ensure data types match the function requirements
#REF! Error
Cause: Invalid cell references or deleted ranges
Solution: Check that all referenced ranges exist and are accessible
Unexpected Results with Hidden Rows
Cause: Using function numbers 1-11 when you want to exclude manually hidden rows
Solution: Use function numbers 101-111 to ignore all hidden rows
Best Practices for Using SUBTOTAL
Choose the Right Function Number
Always consider whether you want to include manually hidden rows in your calculations. Use 101-111 for complete exclusion of hidden data.
Use with Excel Tables
Combine SUBTOTAL with structured table references for maximum flexibility and automatic range expansion.
Document Your Formulas
Add comments to cells containing SUBTOTAL functions to explain which function number you’re using and why.
Test with Different Filter Combinations
Always test your SUBTOTAL formulas with various filter combinations to ensure they behave as expected.
Performance Considerations
SUBTOTAL functions generally perform well, but consider these optimization tips:
- Limit Range Size: Use specific ranges rather than entire columns for better performance
- Avoid Volatile Functions: Don’t combine SUBTOTAL with volatile functions like NOW() or RAND() unless necessary
- Use Tables: Excel Tables with SUBTOTAL often perform better than traditional ranges
Real-World Applications
Financial Reports
Create dynamic financial reports where totals automatically update based on date filters, department filters, or account type filters.
Sales Analysis
Build sales dashboards that show different metrics (sum, average, count) for filtered product categories, regions, or time periods.
Inventory Management
Track inventory levels with automatic calculations that adjust based on product filters, location filters, or status filters.
Survey Data Analysis
Analyze survey responses with dynamic statistics that update based on demographic filters or response criteria.
Integration with Other Excel Features
Pivot Tables
While Pivot Tables offer similar functionality, SUBTOTAL provides more control and can be used within custom report layouts.
Conditional Formatting
Use SUBTOTAL results to drive conditional formatting rules that highlight important trends in filtered data.
Charts and Graphs
Base chart data ranges on SUBTOTAL calculations to create dynamic visualizations that update with filters.
Troubleshooting Common Issues
Formula Not Updating with Filters
Ensure you’re using SUBTOTAL, not regular functions like SUM. Check that your function number is correct for your needs.
Including Header Rows
Make sure your SUBTOTAL range doesn’t include header rows, as this can skew calculations.
Mixed Data Types
When using COUNT (function 2), ensure you understand the difference between COUNT (numbers only) and COUNTA (all non-empty cells).
Conclusion
The Excel SUBTOTAL function is an essential tool for anyone working with filtered data in Excel. Its ability to automatically adjust calculations based on visible rows makes it invaluable for creating dynamic reports, dashboards, and analyses.
By mastering the different function numbers, understanding when to use 1-11 versus 101-111, and applying best practices, you can create more intelligent and responsive Excel workbooks. Whether you’re building financial reports, analyzing sales data, or creating interactive dashboards, SUBTOTAL provides the foundation for professional-quality data analysis.
Remember to always test your SUBTOTAL formulas with different filter combinations and consider using Excel Tables for maximum flexibility. With practice, you’ll find SUBTOTAL becomes an indispensable part of your Excel toolkit, enabling you to create more dynamic and user-friendly spreadsheets.
Related Posts
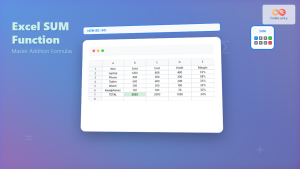
Excel SUM Function: Complete Guide to Addition Formulas and Advanced Techniques
The Excel SUM function is one of the most fundamental and widely-used formulas in Microsoft Excel, designed to add numerical...
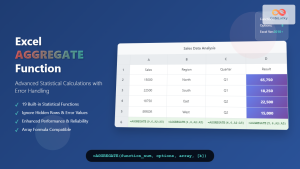
Excel AGGREGATE Function: Complete Guide to Advanced Statistical Calculations
Excel's AGGREGATE function is one of the most powerful and versatile statistical functions available in Microsoft Excel. Unlike traditional statistical...
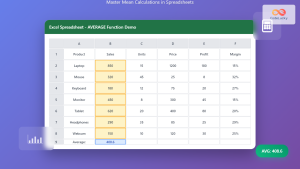
Excel AVERAGE Function: Complete Guide to Mean Calculation with Syntax Examples
The Excel AVERAGE function is one of the most fundamental and widely-used statistical functions in Microsoft Excel. This powerful function...
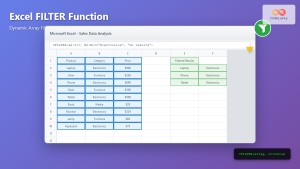
Excel FILTER Function: Complete Guide to Dynamic Array Filtering
The Excel FILTER function is one of the most powerful dynamic array functions introduced in Excel 365 and Excel 2021....
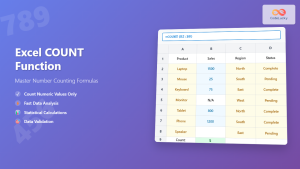
Excel COUNT Function: Complete Guide to Number Counting Formulas
The COUNT function is one of Excel's most fundamental and frequently used statistical functions. Whether you're analyzing sales data, tracking...

Excel SUMPRODUCT Function: Complete Guide to Array Multiplication and Advanced Calculations
What is the Excel SUMPRODUCT Function? The SUMPRODUCT function is one of Excel's most powerful and versatile array functions that...

MySQL SUM Function: Mastering Numeric Aggregation
The SUM() function in MySQL is a powerful tool for aggregating numeric data. It allows you to calculate the total...

Excel SUMIF Function: Complete Guide to Conditional Sum Formulas with Syntax Examples
What is the Excel SUMIF Function? The SUMIF function is one of Excel's most powerful conditional sum formulas that allows...

SQL SUM() Function: Totaling Values
SQL's SUM() function is a powerful tool in a data analyst's arsenal, allowing for quick and efficient calculation of numerical...
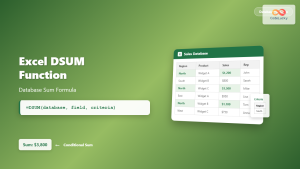
Excel DSUM Function: Complete Database Sum Formula Guide with Examples
The DSUM function in Microsoft Excel is a powerful database function that calculates the sum of values in a database...

Excel SUMIFS Function: Complete Guide to Multiple Criteria Sum Calculations
The SUMIFS function in Microsoft Excel is one of the most powerful tools for performing conditional sum calculations. Unlike the...
Excel AREAS Function: Complete Guide to Count Reference Areas in Formulas
The Excel AREAS function is a powerful reference function that counts the number of areas (separate ranges) within a given...


