The MIRR (Modified Internal Rate of Return) function in Excel is a powerful financial tool that provides a more realistic measure of investment profitability compared to the traditional IRR function. This comprehensive guide will walk you through everything you need to know about using Excel’s MIRR function effectively.
What is the MIRR Function in Excel?
The MIRR function calculates the modified internal rate of return for a series of cash flows, taking into account both the cost of borrowing money (finance rate) and the rate earned on reinvestment of cash flows (reinvestment rate). Unlike IRR, MIRR assumes that positive cash flows are reinvested at the reinvestment rate and negative cash flows are financed at the finance rate.
MIRR Function Syntax
The syntax for the MIRR function is:
=MIRR(values, finance_rate, reinvest_rate)Parameters Explained:
- values (required): An array or range of cells containing cash flow values. Must contain at least one positive and one negative value.
- finance_rate (required): The interest rate paid on money used in cash flows (financing rate).
- reinvest_rate (required): The interest rate received on cash flows as they are reinvested (reinvestment rate).
Key Differences Between MIRR and IRR
Understanding the distinction between MIRR and IRR is crucial for accurate financial analysis:
| Aspect | IRR | MIRR |
|---|---|---|
| Reinvestment Assumption | Assumes reinvestment at IRR rate | Uses specified reinvestment rate |
| Financing Assumption | No separate financing rate | Uses specified finance rate |
| Multiple Solutions | Can have multiple solutions | Always returns single solution |
| Realism | Less realistic assumptions | More realistic assumptions |
Step-by-Step MIRR Function Examples
Example 1: Basic MIRR Calculation
Let’s calculate MIRR for a simple investment scenario:
Cash Flow Data:
- Initial Investment: -$100,000 (Year 0)
- Year 1: +$30,000
- Year 2: +$40,000
- Year 3: +$50,000
- Finance Rate: 10%
- Reinvestment Rate: 8%
Formula:
=MIRR(B2:B5, 10%, 8%)Where B2:B5 contains the cash flow values (-100000, 30000, 40000, 50000).
Result: The MIRR would be approximately 12.61%, indicating the modified rate of return for this investment.
Example 2: Real Estate Investment Analysis
Consider a real estate investment with the following cash flows:
- Property Purchase: -$500,000
- Renovation Costs: -$50,000
- Annual Rental Income Years 1-5: +$60,000 each
- Property Sale (Year 5): +$650,000
- Finance Rate: 6% (mortgage rate)
- Reinvestment Rate: 4% (conservative investment return)
Setup in Excel:
A1: Year    B1: Cash Flow
A2: 0       B2: -500000
A3: 0       B3: -50000
A4: 1       B4: 60000
A5: 2       B5: 60000
A6: 3       B6: 60000
A7: 4       B7: 60000
A8: 5       B8: 710000
MIRR Formula:
=MIRR(B2:B8, 6%, 4%)Common MIRR Function Errors and Solutions
#DIV/0! Error
This error occurs when all cash flows have the same sign (all positive or all negative). MIRR requires at least one positive and one negative cash flow.
Solution: Ensure your cash flow series includes both inflows and outflows.
#NUM! Error
This error appears when MIRR cannot find a solution, typically when the calculation results in a complex number.
Solution: Check your cash flow sequence and ensure realistic finance and reinvestment rates.
#VALUE! Error
Occurs when non-numeric values are included in the cash flow range.
Solution: Verify that all values in the range are numbers, not text or empty cells.
Advanced MIRR Applications
Project Comparison Using MIRR
When comparing multiple investment projects, MIRR provides a more accurate comparison than IRR because it uses consistent reinvestment assumptions.
Example Setup:
        Project A    Project B
Year 0   -100000     -120000
Year 1    30000       40000
Year 2    40000       50000
Year 3    50000       60000

MIRR A: =MIRR(B2:B5, 8%, 6%)
MIRR B: =MIRR(C2:C5, 8%, 6%)
Sensitivity Analysis with MIRR
Create a data table to analyze how changes in finance and reinvestment rates affect MIRR:
=MIRR($B$2:$B$5, C1, $A2)Where C1 contains finance rates and A2 contains reinvestment rates in a two-way data table.
MIRR Best Practices and Tips
Choosing Appropriate Rates
- Finance Rate: Use the company’s weighted average cost of capital (WACC) or borrowing rate
- Reinvestment Rate: Use a conservative rate reflecting realistic reinvestment opportunities
Cash Flow Timing
MIRR assumes cash flows occur at the end of each period. For more precise calculations with mid-period cash flows, consider using XMIRR function if available.
Combining with Other Functions
Enhance MIRR analysis by combining it with other Excel functions:
=IF(MIRR(B2:B10, 0.08, 0.06) > 0.12, "Accept", "Reject")MIRR vs NPV: When to Use Each
While MIRR provides a percentage return, NPV gives absolute dollar value. Use both for comprehensive analysis:
- Use MIRR when comparing projects of different scales or when reinvestment assumptions are important
- Use NPV when you need to know the absolute value creation or when projects have different durations
Troubleshooting MIRR Calculations
Checking Your Work
Verify MIRR calculations by:
- Ensuring cash flows are in chronological order
- Confirming at least one positive and one negative cash flow
- Double-checking finance and reinvestment rate inputs
- Comparing results with manual calculations for simple cases
Alternative Approaches
If MIRR doesn’t suit your needs, consider:
- IRR: For traditional internal rate of return
- XIRR: For irregular cash flow timing
- NPV: For absolute value analysis
Real-World MIRR Applications
Capital Budgeting
MIRR is extensively used in capital budgeting to evaluate and rank investment projects, providing more realistic return expectations than IRR.
Portfolio Management
Investment managers use MIRR to assess portfolio performance, accounting for the actual reinvestment opportunities available.
Business Valuation
When valuing businesses or investment opportunities, MIRR provides a more conservative and realistic rate of return estimate.
Conclusion
Excel’s MIRR function is an essential tool for financial analysis, offering more realistic assumptions than traditional IRR calculations. By understanding its syntax, applications, and limitations, you can make more informed investment decisions and provide more accurate financial projections.
Remember to always consider the specific context of your analysis when choosing finance and reinvestment rates, and use MIRR in conjunction with other financial metrics for comprehensive investment evaluation. With practice and proper application, the MIRR function will become an invaluable part of your Excel financial toolkit.
Related Posts
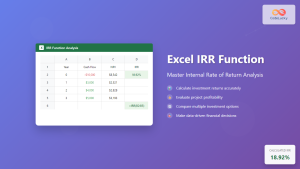
Excel IRR Function: Complete Guide to Internal Rate of Return Analysis
The Excel IRR function is one of the most powerful financial analysis tools available in Microsoft Excel, designed to calculate...

Excel FV Function: Complete Guide to Future Value Calculations
The Excel FV (Future Value) function is a powerful financial tool that calculates the future value of an investment based...

Excel RATE Function: Complete Guide to Interest Rate Calculations
The Excel RATE function is a powerful financial tool that calculates the interest rate per period for an annuity or...

Excel NPER Function: Master Payment Period Calculations with Complete Syntax Guide
What is the Excel NPER Function? The NPER function in Microsoft Excel is a powerful financial function that calculates the...

Excel NPV Function: Complete Guide to Net Present Value Calculations
The Excel NPV (Net Present Value) function is one of the most powerful financial tools available in Microsoft Excel, enabling...

Excel PMT Function: Complete Guide to Payment Calculations
The PMT function in Microsoft Excel is one of the most powerful financial tools for calculating periodic payments for loans,...

Excel PV Function: Master Present Value Calculations with Complete Formula Guide
The Excel PV function is one of the most powerful financial tools available in Microsoft Excel, enabling users to calculate...

Excel DB Function: Complete Guide to Declining Balance Depreciation Calculations
The Excel DB function is a powerful financial tool that calculates the depreciation of an asset using the declining balance...
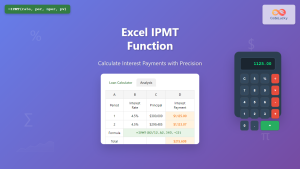
Excel IPMT Function: Calculate Interest Payments with Precision
The IPMT function in Microsoft Excel is a powerful financial tool that calculates the interest payment for a specific period...

Excel DAVERAGE Function: Complete Guide to Database Average Calculations
The DAVERAGE function in Microsoft Excel is a powerful database function that calculates the average of values in a database...
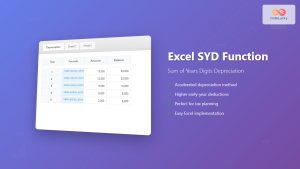
Excel SYD Function: Complete Guide to Sum of Years Digits Depreciation
The Excel SYD function is a powerful financial tool that calculates depreciation using the sum-of-years-digits method. This accelerated depreciation method...

NumPy Finance: Time Value of Money Calculations
NumPy, the fundamental package for scientific computing in Python, provides powerful tools for financial analysis. This article explores NumPy's capabilities...