The Excel IRR function is one of the most powerful financial analysis tools available in Microsoft Excel, designed to calculate the Internal Rate of Return for a series of cash flows. Whether you’re evaluating investment opportunities, analyzing project profitability, or making strategic business decisions, understanding how to use the IRR function effectively can significantly enhance your financial modeling capabilities.
What is the IRR Function in Excel?
The IRR (Internal Rate of Return) function in Excel calculates the discount rate that makes the net present value (NPV) of a series of cash flows equal to zero. In simpler terms, it determines the rate of return that an investment generates based on its cash inflows and outflows over time.
The Internal Rate of Return represents the percentage rate earned on each dollar invested for each period it remains invested. This metric is crucial for comparing different investment opportunities and determining whether a project meets minimum profitability requirements.
Excel IRR Function Syntax
The basic syntax for the Excel IRR function is straightforward:
=IRR(values, [guess])Parameters Explained:
- values (required): An array or reference to cells containing the cash flows for which you want to calculate the IRR. This must include at least one positive and one negative value.
- guess (optional): Your initial estimate of what the IRR might be. If omitted, Excel uses 0.1 (10%) as the default starting point.
How to Use the IRR Function: Step-by-Step Guide
Basic IRR Calculation Example
Let’s start with a simple example to demonstrate how the IRR function works:
Suppose you have an investment opportunity with the following cash flows:
- Initial investment: -$10,000 (Year 0)
- Year 1 return: $3,000
- Year 2 return: $4,000
- Year 3 return: $5,000
To calculate the IRR:
- Enter your cash flows in a column (A1 through A4)
- In cell B1, enter the formula:
=IRR(A1:A4) - Press Enter to get your result
The result will show approximately 18.92%, meaning this investment generates an internal rate of return of about 19%.
Advanced IRR Function Applications
Using the Guess Parameter
Sometimes Excel’s default guess of 10% may not converge to a solution, especially with complex cash flow patterns. In such cases, providing a custom guess can help:
=IRR(A1:A10, 0.15)This formula uses 15% as the initial guess instead of the default 10%.
Handling Irregular Cash Flows
The IRR function works well with irregular cash flows that don’t follow a standard pattern. For example, consider a real estate investment with varying rental income:
- Initial investment: -$50,000
- Year 1: $8,000
- Year 2: $12,000
- Year 3: $15,000
- Year 4: $18,000
- Year 5: $25,000 (including sale proceeds)
Using =IRR(range) will calculate the annualized return for this investment scenario.
IRR vs XIRR: Understanding the Difference
While the standard IRR function assumes cash flows occur at regular intervals (typically annually), Excel also provides the XIRR function for irregular timing:
- IRR: Best for regular, periodic cash flows
- XIRR: Designed for cash flows occurring at specific dates
Use XIRR when your cash flows don’t follow a standard annual pattern, as it provides more accurate results for real-world scenarios.
Common IRR Function Errors and Solutions
#NUM! Error
This error typically occurs when:
- Excel cannot find a solution after 20 iterations
- The cash flow series doesn’t contain both positive and negative values
- The calculation doesn’t converge to a single result
Solution: Try adjusting the guess parameter or check your cash flow data for accuracy.
#VALUE! Error
This error appears when:
- The values array contains text instead of numbers
- The array reference is incorrect
Solution: Ensure all cash flow values are numeric and properly referenced.
Practical IRR Applications in Business
Project Evaluation
Companies use IRR to evaluate capital projects by comparing the calculated IRR against their required rate of return (hurdle rate). Projects with IRR above the hurdle rate are typically considered viable investments.
Investment Comparison
When comparing multiple investment opportunities, IRR provides a standardized metric for evaluation. Higher IRR generally indicates more attractive investments, though other factors should also be considered.
Loan Analysis
From a borrower’s perspective, IRR can help determine the true cost of a loan when considering fees, varying payment schedules, and other factors beyond the stated interest rate.
IRR Function Limitations and Considerations
Multiple IRR Solutions
Some cash flow patterns can produce multiple valid IRR solutions. This typically occurs with alternating positive and negative cash flows. In such cases, consider using Modified Internal Rate of Return (MIRR) for more reliable results.
Scale Independence
IRR doesn’t consider the absolute size of investments. A project with 25% IRR on a $1,000 investment may not be preferable to a 20% IRR on a $100,000 investment in terms of absolute dollar returns.
Reinvestment Assumption
IRR assumes that interim cash flows are reinvested at the IRR rate itself, which may not be realistic in practice.
Best Practices for Using Excel IRR Function
Data Organization
- Arrange cash flows chronologically in a single column
- Use negative values for outflows (investments, costs)
- Use positive values for inflows (returns, revenues)
- Include the initial investment as the first value
Validation Techniques
- Cross-check IRR results with NPV calculations
- Test different guess values to ensure convergence
- Compare results with alternative calculation methods
Documentation
- Clearly label cash flow periods
- Document assumptions and methodology
- Include sensitivity analysis for key variables
Advanced IRR Modeling Techniques
Sensitivity Analysis
Create scenarios with different cash flow assumptions to understand how changes impact IRR. Use Excel’s Data Table feature to automatically calculate IRR across multiple scenarios.
Monte Carlo Simulation
For complex projects with uncertain cash flows, combine IRR calculations with Monte Carlo simulation to understand the range of possible outcomes and their probabilities.
Integration with Financial Models
Incorporate IRR calculations into comprehensive financial models that include detailed cash flow projections, scenario analysis, and risk assessment components.
Troubleshooting IRR Calculations
Convergence Issues
When Excel struggles to find a solution:
- Try different guess values between -1 and 1
- Check for data entry errors
- Consider using XIRR for irregular cash flows
- Examine cash flow patterns for unusual sequences
Accuracy Verification
To verify IRR accuracy:
- Calculate NPV using the IRR as the discount rate (should equal zero)
- Compare with manual IRR calculations for simple cases
- Use alternative software or financial calculators for validation
IRR Function in Financial Modeling Context
The IRR function becomes particularly powerful when integrated into comprehensive financial models. Consider combining IRR analysis with:
- NPV calculations for absolute value assessment
- Payback period analysis for timing considerations
- Sensitivity tables for risk evaluation
- Scenario modeling for strategic planning
Conclusion
The Excel IRR function is an essential tool for financial analysis, offering powerful capabilities for investment evaluation and project assessment. By understanding its syntax, applications, and limitations, you can leverage this function to make more informed financial decisions.
Remember that while IRR provides valuable insights, it should be used alongside other financial metrics for comprehensive analysis. Practice with various scenarios and cash flow patterns to build confidence in using this powerful Excel function effectively.
Whether you’re analyzing investment opportunities, evaluating business projects, or conducting financial planning, mastering the IRR function will enhance your analytical capabilities and support better decision-making in your professional endeavors.
Related Posts
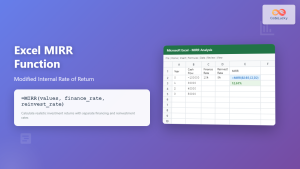
Excel MIRR Function: Complete Guide to Modified Internal Rate of Return Calculations
The MIRR (Modified Internal Rate of Return) function in Excel is a powerful financial tool that provides a more realistic...

Excel NPV Function: Complete Guide to Net Present Value Calculations
The Excel NPV (Net Present Value) function is one of the most powerful financial tools available in Microsoft Excel, enabling...

Excel FV Function: Complete Guide to Future Value Calculations
The Excel FV (Future Value) function is a powerful financial tool that calculates the future value of an investment based...

Excel RATE Function: Complete Guide to Interest Rate Calculations
The Excel RATE function is a powerful financial tool that calculates the interest rate per period for an annuity or...

Excel PV Function: Master Present Value Calculations with Complete Formula Guide
The Excel PV function is one of the most powerful financial tools available in Microsoft Excel, enabling users to calculate...

Excel NPER Function: Master Payment Period Calculations with Complete Syntax Guide
What is the Excel NPER Function? The NPER function in Microsoft Excel is a powerful financial function that calculates the...

Excel PMT Function: Complete Guide to Payment Calculations
The PMT function in Microsoft Excel is one of the most powerful financial tools for calculating periodic payments for loans,...
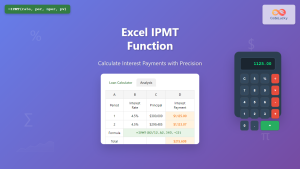
Excel IPMT Function: Calculate Interest Payments with Precision
The IPMT function in Microsoft Excel is a powerful financial tool that calculates the interest payment for a specific period...

Excel DB Function: Complete Guide to Declining Balance Depreciation Calculations
The Excel DB function is a powerful financial tool that calculates the depreciation of an asset using the declining balance...
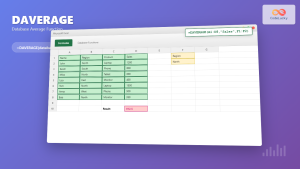
Excel DAVERAGE Function: Complete Guide to Database Average Calculations
The DAVERAGE function in Microsoft Excel is a powerful database function that calculates the average of values in a database...
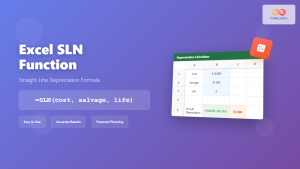
Excel SLN Function: Complete Guide to Straight Line Depreciation Calculations
The SLN function in Excel is a powerful financial tool that calculates straight-line depreciation for assets over their useful life....

NumPy Finance: Time Value of Money Calculations
NumPy, the fundamental package for scientific computing in Python, provides powerful tools for financial analysis. This article explores NumPy's capabilities...