
The AVERAGEIFS function in Microsoft Excel is a powerful statistical tool that enables users to calculate the average of cells that meet multiple criteria simultaneously. Unlike the basic AVERAGE function, AVERAGEIFS provides advanced filtering capabilities, making it essential for complex data analysis and business intelligence tasks.
Understanding the AVERAGEIFS Function
AVERAGEIFS is part of Excel’s conditional statistical functions family, designed to perform calculations based on specified conditions. This function evaluates multiple criteria across different ranges and returns the average of values that satisfy all conditions.
Key Benefits of Using AVERAGEIFS
- Multiple Condition Handling: Process up to 127 different criteria pairs
- Enhanced Data Analysis: Filter and analyze large datasets efficiently
- Business Intelligence: Generate meaningful insights from complex data
- Flexible Criteria: Support for text, numbers, dates, and wildcards
AVERAGEIFS Function Syntax
The AVERAGEIFS function follows a specific syntax structure that must be understood for proper implementation:
=AVERAGEIFS(average_range, criteria_range1, criteria1, [criteria_range2, criteria2], ...)
Parameter Breakdown
- average_range: The range of cells to calculate the average from
- criteria_range1: The first range to evaluate against criteria1
- criteria1: The condition that cells in criteria_range1 must meet
- criteria_range2, criteria2: Additional optional criteria pairs (up to 127 pairs)
Basic AVERAGEIFS Examples
Single Criterion Example
Consider a sales dataset where you want to calculate the average sales for a specific region:
| Region | Sales |
|---|---|
| North | 5000 |
| South | 7500 |
| North | 6200 |
=AVERAGEIFS(B2:B4, A2:A4, "North")Result: 5600 (average of 5000 and 6200)
Multiple Criteria Example
For more complex analysis, you might need to average sales based on both region and product type:
| Region | Product | Sales |
|---|---|---|
| North | Laptop | 5000 |
| South | Laptop | 7500 |
| North | Desktop | 6200 |
=AVERAGEIFS(C2:C4, A2:A4, "North", B2:B4, "Laptop")Result: 5000 (only one North + Laptop combination)
Advanced AVERAGEIFS Techniques
Using Comparison Operators
AVERAGEIFS supports various comparison operators for numerical and date-based criteria:
- Greater than:
">5000" - Less than or equal:
"<=10000" - Not equal:
"<>North" - Between values: Combine multiple criteria
=AVERAGEIFS(C2:C10, C2:C10, ">5000", C2:C10, "<10000")
Wildcard Characters
Use wildcards for partial text matching:
- Asterisk (*): Represents any sequence of characters
- Question mark (?): Represents any single character
- Tilde (~): Escapes wildcard characters
=AVERAGEIFS(B2:B10, A2:A10, "North*")Matches “North”, “Northern”, “Northeast”, etc.
Date-Based Criteria in AVERAGEIFS
Working with dates requires specific formatting and consideration of Excel’s date system:
Date Range Filtering
=AVERAGEIFS(C2:C100, A2:A100, ">="&DATE(2024,1,1))
Month and Year Filtering
For specific time periods, combine multiple date criteria:
=AVERAGEIFS(C2:C100, A2:A100, ">="&DATE(2024,1,1), A2:A100, "<="&DATE(2024,3,31))
Common AVERAGEIFS Errors and Solutions
Error Types and Fixes
Solution: Use IFERROR to handle empty results:
=IFERROR(AVERAGEIFS(B2:B10, A2:A10, "North"), "No data found")
Range Size Mismatch
Ensure all criteria ranges have the same dimensions as the average range or each other when logically required.
Text Case Sensitivity
AVERAGEIFS is not case-sensitive, but exact spelling matters. Use TRIM function to remove extra spaces:
=AVERAGEIFS(C2:C10, A2:A10, TRIM("North "))
Real-World Business Applications
Sales Performance Analysis
Calculate average sales performance across multiple dimensions:
- Regional performance by quarter
- Product category analysis by salesperson
- Customer segment profitability
- Seasonal trend analysis
Financial Reporting
Generate sophisticated financial metrics:
- Average expenses by department and month
- Revenue per customer segment
- Cost analysis by project type
- Budget variance calculations
Human Resources Analytics
Analyze workforce data effectively:
- Average salary by department and experience level
- Performance ratings by role and tenure
- Training completion rates by team
- Attendance patterns by shift and season
Performance Optimization Tips
Efficient Formula Design
- Minimize range sizes: Use only necessary data ranges
- Sort data: Organize data logically for better performance
- Use named ranges: Improve readability and maintenance
- Avoid volatile functions: Minimize recalculation overhead
Alternative Approaches
For extremely large datasets, consider:
- Pivot Tables for complex multi-dimensional analysis
- Power Query for data transformation
- Array formulas for advanced calculations
- Database functions for structured queries
AVERAGEIFS vs. Other Excel Functions
Comparison with AVERAGEIF
| Feature | AVERAGEIF | AVERAGEIFS |
|---|---|---|
| Criteria Count | Single | Multiple (up to 127) |
| Complexity | Simple | Advanced |
| Performance | Faster | Slower with multiple criteria |
Integration with Other Functions
Combine AVERAGEIFS with other Excel functions for powerful analysis:
=B2>AVERAGEIFS($C$2:$C$100,$A$2:$A$100,$A2)
Best Practices and Pro Tips
Formula Documentation
- Use clear, descriptive criteria strings
- Add comments to complex formulas
- Create named ranges for better readability
- Document assumptions and data sources
Data Validation
- Verify data consistency before analysis
- Handle missing values appropriately
- Test formulas with edge cases
- Validate results against manual calculations
Maintenance and Updates
- Design flexible formulas for expanding datasets
- Use dynamic ranges when possible
- Regular testing after data updates
- Version control for complex workbooks
Troubleshooting Common Issues
Unexpected Results
When AVERAGEIFS returns unexpected values:
- Check data types in criteria ranges
- Verify criteria syntax and spelling
- Examine hidden characters or spaces
- Test with simpler criteria first
Performance Problems
For slow-performing AVERAGEIFS formulas:
- Reduce range sizes to essential data only
- Consider using helper columns for complex criteria
- Implement data organization strategies
- Evaluate alternative calculation methods
Advanced Use Cases
Dynamic Criteria
Create flexible formulas using cell references for criteria:
=AVERAGEIFS(C2:C100, A2:A100, E1, B2:B100, F1)Where E1 and F1 contain user-selectable criteria values
Array-Based Calculations
Combine AVERAGEIFS with array functions for complex scenarios:
=AVERAGE(IF((A2:A100=E1)*(B2:B100=F1), C2:C100))Array formula equivalent (Ctrl+Shift+Enter in older Excel versions)
Conclusion
The AVERAGEIFS function is an indispensable tool for advanced Excel users who need to perform sophisticated data analysis with multiple conditions. Its flexibility in handling various data types, comparison operators, and wildcard characters makes it suitable for a wide range of business and analytical applications.
Mastering AVERAGEIFS enables users to extract meaningful insights from complex datasets, create dynamic reports, and perform detailed business intelligence analysis. Whether you’re analyzing sales performance, financial data, or operational metrics, AVERAGEIFS provides the precision and flexibility needed for professional-grade data analysis.
By following the best practices, optimization techniques, and troubleshooting strategies outlined in this guide, you’ll be well-equipped to leverage the full power of Excel’s AVERAGEIFS function in your data analysis workflows.
Related Posts

Excel AVERAGEIF Function: Complete Guide to Conditional Average Formulas
What is the Excel AVERAGEIF Function? The AVERAGEIF function is one of Excel's most powerful statistical tools that calculates the...

Excel SUMIFS Function: Complete Guide to Multiple Criteria Sum Calculations
The SUMIFS function in Microsoft Excel is one of the most powerful tools for performing conditional sum calculations. Unlike the...

Excel COUNTIF Function: Master Conditional Counting with Advanced Formulas
The Excel COUNTIF function is one of the most powerful and frequently used conditional functions in Microsoft Excel. It allows...

Excel COUNTIFS Function: Master Multiple Criteria Counting with Advanced Examples
The COUNTIFS function in Microsoft Excel is a powerful statistical tool that allows you to count cells based on multiple...

Excel DAVERAGE Function: Complete Guide to Database Average Calculations
The DAVERAGE function in Microsoft Excel is a powerful database function that calculates the average of values in a database...

Excel SUMIF Function: Complete Guide to Conditional Sum Formulas with Syntax Examples
What is the Excel SUMIF Function? The SUMIF function is one of Excel's most powerful conditional sum formulas that allows...
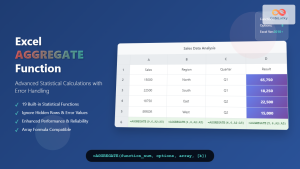
Excel AGGREGATE Function: Complete Guide to Advanced Statistical Calculations
Excel's AGGREGATE function is one of the most powerful and versatile statistical functions available in Microsoft Excel. Unlike traditional statistical...
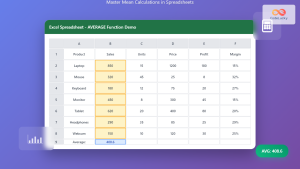
Excel AVERAGE Function: Complete Guide to Mean Calculation with Syntax Examples
The Excel AVERAGE function is one of the most fundamental and widely-used statistical functions in Microsoft Excel. This powerful function...

Excel AND Function: Complete Guide to Multiple Criteria Logic Testing
The Excel AND function is one of the most powerful logical functions that allows you to test multiple conditions simultaneously...
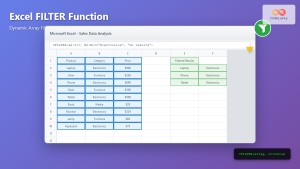
Excel FILTER Function: Complete Guide to Dynamic Array Filtering
The Excel FILTER function is one of the most powerful dynamic array functions introduced in Excel 365 and Excel 2021....
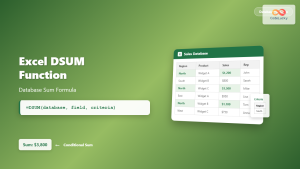
Excel DSUM Function: Complete Database Sum Formula Guide with Examples
The DSUM function in Microsoft Excel is a powerful database function that calculates the sum of values in a database...

Excel SUMPRODUCT Function: Complete Guide to Array Multiplication and Advanced Calculations
What is the Excel SUMPRODUCT Function? The SUMPRODUCT function is one of Excel's most powerful and versatile array functions that...


