Debugging is an essential skill for any C programmer. It's the process of finding and fixing errors in your code, and it can often be the most time-consuming part of software development. One of the most powerful tools at your disposal for debugging C programs is the GNU Debugger, commonly known as GDB. In this comprehensive guide, we'll explore how to use GDB effectively to troubleshoot your C programs.
What is GDB?
GDB (GNU Debugger) is a powerful, open-source debugger that supports multiple programming languages, including C. It allows you to see what's happening inside your program while it executes, or what your program was doing at the moment it crashed.
🔍 Key Features of GDB:
- Set breakpoints to pause program execution
- Step through code line by line
- Inspect variable values at runtime
- Modify variables during execution
- Analyze core dumps for post-mortem debugging
Setting Up GDB
Before we dive into using GDB, let's make sure it's properly set up on your system.
Installation
On most Unix-like systems, GDB can be installed using the package manager:
# For Ubuntu or Debian
sudo apt-get install gdb

# For Fedora
sudo dnf install gdb

# For macOS (using Homebrew)
brew install gdb
Compiling for Debugging
To use GDB effectively, you need to compile your C program with debugging symbols. This is done using the -g flag with gcc:
gcc -g your_program.c -o your_program
This command compiles your_program.c with debugging symbols and creates an executable named your_program.
Basic GDB Commands
Let's start with a simple C program to demonstrate basic GDB commands:
#include <stdio.h>

int main() {
    int x = 5;
    int y = 0;
    int result = x / y;  // This will cause a division by zero error
    printf("Result: %d\n", result);
    return 0;
}
Save this as divide.c and compile it with debugging symbols:
gcc -g divide.c -o divide
Now, let's start GDB:
gdb ./divide
You'll see the GDB prompt:
(gdb)
Here are some basic commands to get you started:
-
run (r): Starts the program
(gdb) run -
break (b): Sets a breakpoint
(gdb) break mainThis sets a breakpoint at the beginning of the
mainfunction. -
next (n): Executes the next line of code
(gdb) next -
step (s): Steps into a function call
(gdb) step -
print (p): Prints the value of a variable
(gdb) print x -
continue (c): Continues execution until the next breakpoint or program end
(gdb) continue -
quit (q): Exits GDB
(gdb) quit
Debugging Our Example Program
Let's debug our divide program:
-
Start GDB:
gdb ./divide -
Set a breakpoint at the main function:
(gdb) break main Breakpoint 1 at 0x1149: file divide.c, line 4. -
Run the program:
(gdb) run Starting program: /path/to/divide Breakpoint 1, main () at divide.c:4 4 int x = 5; -
Step through the code:
(gdb) next 5 int y = 0; (gdb) next 6 int result = x / y; // This will cause a division by zero error -
Print the values of x and y:
(gdb) print x $1 = 5 (gdb) print y $2 = 0 -
Continue execution:
(gdb) continue
Continuing.

Program received signal SIGFPE, Arithmetic exception.
0x0000555555555159 in main () at divide.c:6
6       int result = x / y;  // This will cause a division by zero error
GDB has caught the division by zero error and stopped the program execution.
Advanced GDB Features
Now that we've covered the basics, let's explore some more advanced features of GDB.
Watchpoints
Watchpoints allow you to stop the program when a variable's value changes. Let's modify our program slightly:
#include <stdio.h>

int main() {
    int x = 5;
    int y = 2;
    for (int i = 0; i < 3; i++) {
        x *= y;
        printf("x = %d\n", x);
    }
    return 0;
}
Save this as multiply.c and compile it with debugging symbols. Now, let's use a watchpoint:
-
Start GDB and run to the main function:
(gdb) break main (gdb) run -
Set a watchpoint on x:
(gdb) watch x Hardware watchpoint 2: x -
Continue execution:
(gdb) continue
Continuing.
Hardware watchpoint 2: x

Old value = 5
New value = 10
main () at multiply.c:7
7           printf("x = %d\n", x);
The program stops each time x changes, allowing you to track its value throughout the program's execution.
Backtrace
The backtrace command shows you the call stack at the point where the program stopped. This is particularly useful for understanding how your program reached a certain point. Let's look at an example:
#include <stdio.h>

void func3() {
    int z = 0;
    int result = 10 / z;  // Division by zero
}

void func2() {
    func3();
}

void func1() {
    func2();
}

int main() {
    func1();
    return 0;
}
Save this as backtrace_example.c and compile it with debugging symbols. Now, let's use GDB to examine the backtrace:
-
Start GDB and run the program:
(gdb) run Starting program: /path/to/backtrace_example Program received signal SIGFPE, Arithmetic exception. x0000555555555149 in func3 () at backtrace_example.c:5 5 int result = 10 / z; // Division by zero -
Use the backtrace command:
(gdb) backtrace
#0  0x0000555555555149 in func3 () at backtrace_example.c:5
#1  0x0000555555555158 in func2 () at backtrace_example.c:9
#2  0x0000555555555167 in func1 () at backtrace_example.c:13
#3  0x0000555555555176 in main () at backtrace_example.c:17
This shows the call stack, with the most recent function call at the top. It helps you understand the sequence of function calls that led to the current point in the program.
Conditional Breakpoints
Conditional breakpoints allow you to pause the program only when certain conditions are met. Let's look at an example:
#include <stdio.h>

int main() {
    for (int i = 0; i < 10; i++) {
        printf("i = %d\n", i);
    }
    return 0;
}
Save this as conditional_break.c and compile it with debugging symbols. Now, let's use a conditional breakpoint:
-
Start GDB and set a conditional breakpoint:
(gdb) break 5 if i == 5 Breakpoint 1 at 0x1149: file conditional_break.c, line 5. -
Run the program:
(gdb) run
Starting program: /path/to/conditional_break
i = 0
i = 1
i = 2
i = 3
i = 4

Breakpoint 1, main () at conditional_break.c:5
5           printf("i = %d\n", i);
The program stops only when i equals 5, allowing you to focus on specific conditions without having to manually step through the entire loop.
Debugging Memory Issues with GDB
Memory-related bugs are among the most challenging to debug in C programs. GDB provides several tools to help identify and fix these issues.
Examining Memory
You can use the x command in GDB to examine memory contents. Let's look at an example:
#include <stdio.h>
#include <string.h>

int main() {
    char str[] = "Hello, World!";
    printf("%s\n", str);
    return 0;
}
Save this as memory_example.c and compile it with debugging symbols. Now, let's examine the memory:
-
Start GDB and run to the main function:
(gdb) break main (gdb) run -
Step to the line after the string initialization:
(gdb) next -
Examine the memory containing the string:
(gdb) x/s &str
0x7fffffffde70: "Hello, World!"
The x/s command tells GDB to examine the memory as a string. You can also use x/x for hexadecimal, x/d for decimal, etc.
Detecting Buffer Overflows
GDB can help you detect buffer overflows. Consider this example:
#include <stdio.h>
#include <string.h>

int main() {
    char buffer[5];
    strcpy(buffer, "Hello, World!");  // Buffer overflow
    printf("%s\n", buffer);
    return 0;
}
Save this as buffer_overflow.c and compile it with debugging symbols and stack protection disabled:
gcc -g -fno-stack-protector buffer_overflow.c -o buffer_overflow
Now, let's use GDB to detect the overflow:
-
Start GDB and set a breakpoint after the strcpy:
(gdb) break 6 (gdb) run -
Examine the memory around the buffer:
(gdb) x/20x buffer
0x7fffffffde70: 0x6c6c6548  0x57202c6f  0x646c726f  0x00002100
0x7fffffffde80: 0x00000000  0x00000000  0x55555555  0x00005555
0x7fffffffde90: 0xffffe078  0x00007fff  0x00000000  0x00000000
You can see that the string "Hello, World!" has overwritten memory beyond the 5 bytes allocated for the buffer.
Best Practices for Debugging with GDB
To make the most of GDB, consider these best practices:
-
Compile with debugging symbols: Always use the
-gflag when compiling for debugging. -
Use meaningful variable names: This makes it easier to understand your code during debugging.
-
Set strategic breakpoints: Place breakpoints at key points in your code to efficiently track program flow.
-
Use conditional breakpoints: These can save time by stopping only when specific conditions are met.
-
Examine variables frequently: Use the
printcommand to check variable values often. -
Utilize watchpoints: These are great for tracking changes to specific variables.
-
Check the backtrace: When encountering an error, always check the backtrace to understand how you got there.
-
Step through code carefully: Use
stepandnextcommands to navigate your code methodically. -
Take advantage of GDB's help: Use
helpcommand in GDB to learn more about specific commands. -
Practice regularly: Debugging is a skill that improves with practice. Try to incorporate GDB into your regular development workflow.
Conclusion
GDB is an incredibly powerful tool for debugging C programs. It allows you to peer into the inner workings of your code, track down elusive bugs, and gain a deeper understanding of how your programs execute. While it may seem daunting at first, with practice, GDB can become an indispensable part of your C programming toolkit.
Remember, effective debugging is not just about using tools like GDB, but also about developing a systematic approach to problem-solving. As you become more proficient with GDB, you'll find that you're able to solve complex programming issues more quickly and efficiently.
Happy debugging!
Related Posts
gdb Command Linux: Complete GNU Debugger Tutorial for Developers
The GNU Debugger (GDB) is one of the most powerful and essential tools for developers working on Linux systems. As...
gcore Command Linux: Complete Guide to Generate Core Dump Files for Debugging
The gcore command in Linux is a powerful debugging tool that generates core dump files from running processes without terminating...
Python breakpoint() Function: Debugging with Breakpoints
Debugging is an essential skill for any programmer, and Python provides several tools to help you find and fix errors...
valgrind Command Linux: Complete Memory Debugging and Profiling Guide
Valgrind is one of the most powerful and essential tools for Linux developers and system administrators who need to debug...
ptrace Command Linux: Complete Guide to Process Tracing System Call
The ptrace system call is one of Linux's most powerful tools for process monitoring and debugging. It allows one process...

C Error Handling: Using errno and perror()
Error handling is a crucial aspect of writing robust and reliable C programs. When things go wrong, it's essential to...
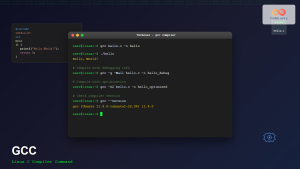
gcc Command Linux: Complete Guide to Compiling C Programs with Examples
The gcc (GNU Compiler Collection) is one of the most essential tools for C programmers working on Linux systems. This...

C Unit Testing: Writing and Running Tests
In the world of software development, ensuring the reliability and correctness of your code is paramount. One of the most...
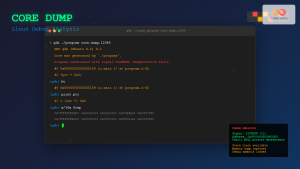
Core Dump Linux: Complete Guide to Debug Program Crashes and Memory Issues
A core dump is a crucial debugging tool in Linux that captures the complete memory state of a program at...
C Break and Continue: Controlling Loop Execution
In the world of C programming, loops are essential structures that allow us to repeat a set of instructions multiple...
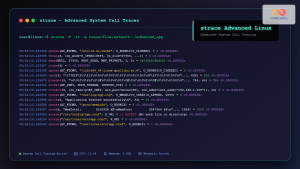
strace Advanced Linux: Complete Guide to System Call Tracing and Debugging
strace is one of the most powerful debugging and diagnostic tools available in Linux systems. It allows you to trace...
ltrace Command Linux: Complete Guide to Trace Library Calls and Debug Programs
The ltrace command is a powerful debugging and analysis tool in Linux that allows you to trace library calls made...