What is Zenoss and Why Use it on Linux?
Zenoss is a powerful, open-source IT infrastructure monitoring platform that provides comprehensive visibility into your entire IT environment. Built with scalability and flexibility in mind, Zenoss excels at monitoring networks, servers, applications, and cloud infrastructure from a single unified platform.
When deployed on Linux systems, Zenoss leverages the robust, stable foundation that Linux provides, making it an ideal choice for enterprise-level monitoring solutions. The platform uses SNMP protocols, WMI, and various other monitoring technologies to collect performance data and provide real-time insights.
Key Benefits of Zenoss on Linux
- Cost-effective monitoring: Open-source core with enterprise features
- Scalable architecture: Handles thousands of devices efficiently
- Comprehensive discovery: Auto-discovers network devices and services
- Advanced analytics: Machine learning-powered anomaly detection
- Flexible alerting: Customizable notification systems
- Rich visualization: Interactive dashboards and reports
System Requirements and Prerequisites
Before installing Zenoss on your Linux system, ensure your environment meets the following requirements:
Minimum Hardware Requirements
| Component | Minimum | Recommended |
|---|---|---|
| CPU | 4 cores, 2.4 GHz | 8+ cores, 3.0 GHz |
| RAM | 8 GB | 16+ GB |
| Storage | 100 GB | 500+ GB SSD |
| Network | 1 Gbps | 10 Gbps |
Supported Linux Distributions
- Red Hat Enterprise Linux (RHEL) 7/8/9
- CentOS 7/8/9
- Ubuntu 18.04/20.04/22.04 LTS
- SUSE Linux Enterprise Server
- Oracle Linux
Installing Zenoss on Linux
Method 1: Docker Installation (Recommended)
The easiest way to get Zenoss running is through Docker containers. This method provides better isolation and easier management.
# Update system packages
sudo apt update && sudo apt upgrade -y

# Install Docker and Docker Compose
sudo apt install docker.io docker-compose -y

# Enable and start Docker service
sudo systemctl enable docker
sudo systemctl start docker

# Add current user to docker group
sudo usermod -aG docker $USER

# Create Zenoss directory
mkdir ~/zenoss && cd ~/zenoss

# Create docker-compose.yml file
cat << EOF > docker-compose.yml
version: '3.8'
services:
  zenoss:
    image: zenoss/zenoss5:latest
    ports:
      - "8080:8080"
    environment:
      - ZENOSS_ADMIN_PASSWORD=admin123
    volumes:
      - zenoss-data:/opt/zenoss
    restart: unless-stopped

  mariadb:
    image: mariadb:10.6
    environment:
      - MYSQL_ROOT_PASSWORD=zenoss123
      - MYSQL_DATABASE=zenoss
      - MYSQL_USER=zenoss
      - MYSQL_PASSWORD=zenoss123
    volumes:
      - mariadb-data:/var/lib/mysql
    restart: unless-stopped

volumes:
  zenoss-data:
  mariadb-data:
EOF

# Start Zenoss services
docker-compose up -d
Method 2: Native Installation on Ubuntu
# Install dependencies
sudo apt update
sudo apt install -y python2.7 python-dev python-setuptools
sudo apt install -y libxml2-dev libxslt1-dev libldap2-dev
sudo apt install -y libsasl2-dev libssl-dev libffi-dev
sudo apt install -y mysql-server redis-server rabbitmq-server

# Download and install Zenoss
wget https://download.zenoss.com/zenoss-5.3.3.tar.gz
tar -xzf zenoss-5.3.3.tar.gz
cd zenoss-5.3.3

# Run installation script
sudo ./install.sh --install-type=core

# Start Zenoss services
sudo systemctl enable zenoss
sudo systemctl start zenoss
Initial Configuration and Setup
Accessing the Web Interface
Once Zenoss is installed and running, access the web interface:
- Open your web browser and navigate to
http://your-server-ip:8080 - Log in with default credentials (admin/admin for Docker, or credentials set during installation)
- Follow the setup wizard to configure basic settings
Basic System Configuration
# Check Zenoss service status
sudo systemctl status zenoss

# View Zenoss logs
sudo tail -f /opt/zenoss/log/event.log

# Restart Zenoss services if needed
sudo systemctl restart zenoss

# Check listening ports
sudo netstat -tlnp | grep :8080
Device Discovery and Monitoring Setup
Automatic Network Discovery
Zenoss can automatically discover devices on your network using various protocols:
- Navigate to Infrastructure → Networks
- Click Add Network
- Enter your network range (e.g., 192.168.1.0/24)
- Configure discovery settings
- Click Discover to start the process
Manual Device Addition
# Using Zenoss command-line interface
# Access Zenoss shell
cd /opt/zenoss
./bin/zenoss

# Add a device manually
device = dmd.Devices.createInstance('server01.example.com')
device.setPerformanceMonitor('localhost')
device.manage_snmpCommunity = 'public'
device.index_object()

# Commit changes
commit()
SNMP Configuration
Configure SNMP monitoring for comprehensive device monitoring:
# Configure SNMP on target Linux server
sudo apt install snmpd snmp-mibs-downloader

# Edit SNMP configuration
sudo nano /etc/snmp/snmpd.conf

# Add the following lines:
# agentAddress udp:161
# rocommunity public default
# syslocation "Data Center"
# syscontact "[email protected]"

# Restart SNMP service
sudo systemctl restart snmpd

# Test SNMP connectivity
snmpwalk -v2c -c public localhost system
Creating Custom Monitoring Templates
Template Structure
Zenoss uses monitoring templates to define what data to collect from devices. Here’s how to create custom templates:
# Create a custom monitoring template
template = dmd.Devices.Server.Linux.rrdTemplates.manage_addRRDTemplate('CustomLinuxTemplate')

# Add data source for CPU monitoring
ds = template.manage_addRRDDataSource('cpu_usage', 'COMMAND')
ds.component = ''
ds.eventClass = '/Status'
ds.severity = 3
ds.commandTemplate = 'top -bn1 | grep "Cpu(s)" | awk \'{print $2}\' | cut -d\'%\' -f1'

# Add threshold
threshold = template.manage_addRRDThreshold('high_cpu', 'MinMaxThreshold')
threshold.dsnames = ['cpu_usage']
threshold.maxval = '80'
threshold.eventClass = '/Status/CPU'
threshold.severity = 4

commit()
Performance Monitoring Datasources
| DataSource Type | Use Case | Example |
|---|---|---|
| COMMAND | Custom scripts | Memory usage, custom metrics |
| SNMP | Network devices | Interface statistics, system info |
| SSH | Remote commands | Log file monitoring, service checks |
| HTTP | Web services | Response time, content checks |
Advanced Monitoring Configurations
Event Processing and Alerting
# Configure event processing rules
# Create custom event class
eventClass = dmd.Events.createOrganizer('/Custom/Application')
eventClass.description = 'Custom application events'

# Add event mapping
mapping = eventClass.instances.manage_addEventClassInst('database_connection_error')
mapping.regex = '.*database.*connection.*failed.*'
mapping.severity = 5
mapping.example = 'Database connection failed: timeout'

# Configure email notifications
notification = dmd.NotificationSubscriptions.manage_addNotificationSubscription('email_alerts')
notification.send_emails = True
notification.email_addresses = ['[email protected]']
notification.delay_seconds = 300

commit()
Custom ZenPacks Development
# Create a new ZenPack
cd /opt/zenoss
./bin/zenpackcmd create ZenPacks.example.CustomMonitoring

# Install the ZenPack
./bin/zenpack --install ZenPacks.example.CustomMonitoring-1.0-py2.7.egg

# List installed ZenPacks
./bin/zenpack --list
Performance Optimization Tips
Database Optimization
-- Optimize MySQL/MariaDB for Zenoss
-- Edit /etc/mysql/mariadb.conf.d/50-server.cnf

[mysqld]
innodb_buffer_pool_size = 4G
innodb_log_file_size = 256M
max_connections = 500
query_cache_size = 256M
tmp_table_size = 64M
max_heap_table_size = 64M
System Tuning
# Increase file descriptor limits
echo "zenoss soft nofile 65536" >> /etc/security/limits.conf
echo "zenoss hard nofile 65536" >> /etc/security/limits.conf

# Optimize kernel parameters
echo "net.core.rmem_max = 16777216" >> /etc/sysctl.conf
echo "net.core.wmem_max = 16777216" >> /etc/sysctl.conf
echo "net.ipv4.tcp_rmem = 4096 87380 16777216" >> /etc/sysctl.conf

# Apply changes
sysctl -p
Monitoring Dashboard Creation
Custom Portlet Development
// Create custom dashboard portlet
// File: /opt/zenoss/Products/ZenUI3/browser/resources/js/zenoss/portlets/CustomPortlet.js

Ext.define('Zenoss.portlets.CustomPortlet', {
    extend: 'Zenoss.portlets.PortletBase',

    initComponent: function() {
        var me = this;

        me.items = [{
            xtype: 'panel',
            html: '',
            listeners: {
                afterrender: function() {
                    me.loadCustomData();
                }
            }
        }];

        me.callParent(arguments);
    },

    loadCustomData: function() {
        // Custom data loading logic
        Ext.Ajax.request({
            url: '/zport/dmd/custom_data',
            success: function(response) {
                var data = Ext.decode(response.responseText);
                // Process and display data
            }
        });
    }
});
Troubleshooting Common Issues
Service Connection Problems
# Check Zenoss daemon status
sudo /opt/zenoss/bin/zenoss status

# Restart specific services
sudo /opt/zenoss/bin/zenoss restart zenactiond
sudo /opt/zenoss/bin/zenoss restart zenhub

# Check log files for errors
tail -f /opt/zenoss/log/zenactiond.log
tail -f /opt/zenoss/log/zenhub.log

# Verify database connectivity
mysql -u zenoss -p -h localhost zenoss
Performance Issues
| Symptom | Possible Cause | Solution |
|---|---|---|
| Slow web interface | Insufficient memory | Increase heap size, add RAM |
| Missing data points | Collection timeout | Adjust collection intervals |
| High CPU usage | Too many devices | Distribute load, optimize queries |
| Database locks | Long-running queries | Optimize database, tune parameters |
Security Hardening
Authentication and Authorization
# Enable LDAP authentication
# Edit /opt/zenoss/etc/zope.conf

# Add LDAP configuration
<ldap-authentication-plugin>
    <ldap-server>
        server ldap://your-ldap-server:389
        bind-dn cn=zenoss,ou=services,dc=example,dc=com
        bind-password your-bind-password
        base-dn dc=example,dc=com
    </ldap-server>
</ldap-authentication-plugin>

# Restart Zenoss
sudo systemctl restart zenoss
SSL Configuration
# Generate SSL certificates
sudo openssl req -x509 -nodes -days 365 -newkey rsa:2048 \
    -keyout /opt/zenoss/etc/zenoss.key \
    -out /opt/zenoss/etc/zenoss.crt

# Configure HTTPS in Zenoss
# Edit /opt/zenoss/etc/zope.conf
# Add SSL configuration block

# Update firewall rules
sudo ufw allow 8443/tcp
sudo ufw reload
Best Practices and Recommendations
Monitoring Strategy
- Start small: Begin with critical systems and expand gradually
- Use templates: Standardize monitoring configurations
- Set meaningful thresholds: Avoid alert fatigue with proper tuning
- Regular maintenance: Clean up old data and optimize performance
- Document configurations: Maintain clear documentation for all customizations
Backup and Recovery
# Create backup script
#!/bin/bash
BACKUP_DIR="/backup/zenoss"
DATE=$(date +%Y%m%d_%H%M%S)

# Stop Zenoss services
sudo systemctl stop zenoss

# Backup database
mysqldump -u zenoss -p zenoss > $BACKUP_DIR/zenoss_db_$DATE.sql

# Backup configuration files
tar -czf $BACKUP_DIR/zenoss_config_$DATE.tar.gz /opt/zenoss/etc/

# Backup custom ZenPacks
tar -czf $BACKUP_DIR/zenoss_zenpacks_$DATE.tar.gz /opt/zenoss/ZenPacks/

# Start services
sudo systemctl start zenoss

echo "Backup completed: $DATE"
Integration with Other Tools
Grafana Integration
# Install Grafana
sudo apt install -y software-properties-common
wget -q -O - https://packages.grafana.com/gpg.key | sudo apt-key add -
sudo add-apt-repository "deb https://packages.grafana.com/oss/deb stable main"
sudo apt update && sudo apt install grafana

# Configure Zenoss data source in Grafana
# Use Zenoss JSON API for data retrieval
curl -X GET "http://zenoss-server:8080/zport/dmd/Devices/getDevices" \
     -H "Authorization: Basic $(echo -n admin:password | base64)"
Conclusion
Zenoss on Linux provides a comprehensive, scalable solution for IT infrastructure monitoring. By following this guide, you’ve learned how to install, configure, and optimize Zenoss for your specific monitoring needs. The platform’s flexibility allows for extensive customization while maintaining ease of use for day-to-day operations.
Remember to regularly update your Zenoss installation, monitor system resources, and fine-tune alerting thresholds to ensure optimal performance. With proper implementation and maintenance, Zenoss will provide valuable insights into your infrastructure health and help prevent issues before they impact your business operations.
Pro Tip: Start with a pilot deployment monitoring a subset of your infrastructure, then gradually expand as you become more familiar with Zenoss capabilities and your specific monitoring requirements.
Related Posts
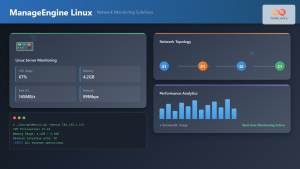
ManageEngine Linux: Complete Network Monitoring Solutions Guide
Network monitoring is crucial for maintaining optimal performance and security in Linux environments. ManageEngine provides powerful network monitoring solutions specifically...
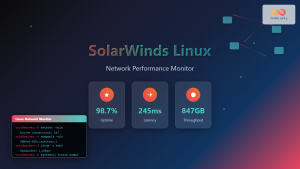
SolarWinds Linux: Complete Network Performance Monitor Guide for System Administrators
SolarWinds Network Performance Monitor (NPM) is a powerful network monitoring solution that provides comprehensive visibility into network infrastructure performance. While...
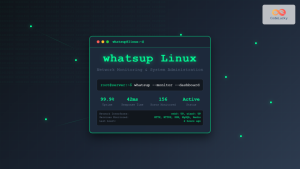
whatsup Linux: Complete Network Monitoring and System Administration Guide
whatsup is a powerful network monitoring and system administration tool for Linux that provides real-time insights into network connectivity, system...
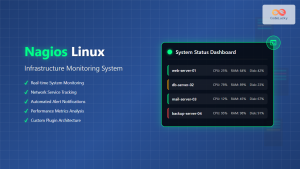
nagios Linux: Complete Infrastructure Monitoring System Setup Guide
Introduction to Nagios Nagios is one of the most popular open-source infrastructure monitoring systems available for Linux environments. Originally developed...
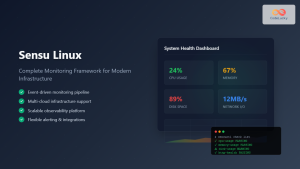
Sensu Linux: Complete Monitoring Framework Guide for System Administrators
Sensu is a powerful, open-source monitoring framework designed to monitor servers, services, application health, and business KPIs. Built with modern...
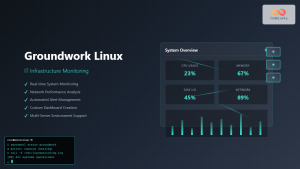
Groundwork Linux: Complete Guide to IT Infrastructure Monitoring and System Health Management
What is Groundwork Linux? Groundwork Linux is a comprehensive open-source IT infrastructure monitoring platform built specifically for Linux environments. It...
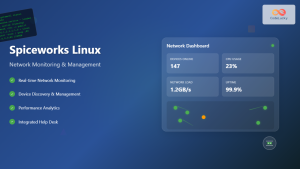
Spiceworks Linux: Complete Network Monitoring and Management Guide
Spiceworks is a powerful, free IT network monitoring and management platform that has revolutionized how system administrators handle their infrastructure....
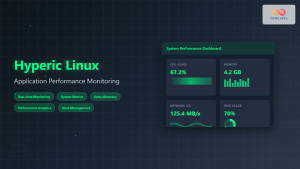
Hyperic Linux: Complete Guide to Application Performance Monitoring and System Optimization
Hyperic is a powerful open-source application performance monitoring (APM) platform that provides comprehensive insights into your Linux systems and applications....
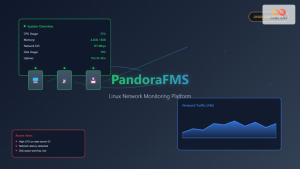
PandoraFMS Linux: Complete Network Monitoring Platform Guide
PandoraFMS is a comprehensive, open-source network monitoring platform that provides complete visibility into your IT infrastructure. This powerful monitoring solution...
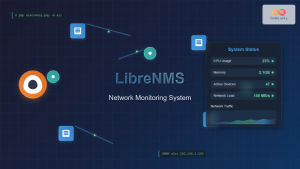
LibreNMS Linux: Complete Network Monitoring System Setup and Configuration Guide
LibreNMS is a powerful, open-source network monitoring platform that provides comprehensive visibility into network infrastructure. Built on PHP and MySQL,...
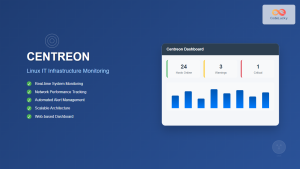
centreon Linux: Complete IT Infrastructure Monitoring Solution Guide
Centreon is a powerful, open-source IT infrastructure monitoring platform built on top of Nagios Core. It provides a comprehensive web-based...
nagiosxi Linux: Complete Enterprise Network Monitoring Guide with Commands and Configuration
NagiosXI represents the pinnacle of enterprise network monitoring solutions on Linux systems, offering comprehensive infrastructure oversight with advanced alerting, reporting,...