
Zabbix stands as one of the most powerful and comprehensive open-source monitoring solutions available for Linux environments. This enterprise-grade monitoring platform provides real-time monitoring capabilities for networks, servers, cloud services, applications, and services, making it an indispensable tool for system administrators and DevOps teams.
What is Zabbix?
Zabbix is a mature, enterprise-class monitoring solution that offers distributed monitoring with a centralized web-based management interface. Originally developed by Alexei Vladishev, Zabbix provides monitoring for thousands of parameters from hundreds of thousands of devices, servers, and applications in real-time.
Key Features of Zabbix
- Real-time monitoring of IT infrastructure components
- Flexible notification system with escalation procedures
- Web-based frontend for easy configuration and management
- Agent and agentless monitoring capabilities
- High-level business service monitoring
- Distributed monitoring with centralized management
- Auto-discovery of network devices and services
- Advanced visualization with graphs, maps, and dashboards
Zabbix Architecture Overview
Understanding Zabbix architecture is crucial for effective deployment and management:
Core Components
- Zabbix Server: The central component that collects and processes data
- Zabbix Database: Stores configuration and collected data
- Zabbix Web Frontend: PHP-based web interface for management
- Zabbix Agent: Lightweight daemon installed on monitored hosts
- Zabbix Proxy: Optional component for distributed monitoring
Installing Zabbix on Linux
Prerequisites
Before installing Zabbix, ensure your Linux system meets the following requirements:
- Supported Linux distributions (Ubuntu, CentOS, RHEL, Debian, SUSE)
- Database server (MySQL/MariaDB, PostgreSQL, or Oracle)
- Web server (Apache or Nginx)
- PHP 7.2 or higher
- Sufficient system resources (minimum 2GB RAM recommended)
Installation on Ubuntu 22.04
Here’s a step-by-step installation process:
Step 1: Add Zabbix Repository
# Download and install Zabbix repository
wget https://repo.zabbix.com/zabbix/6.4/ubuntu/pool/main/z/zabbix-release/zabbix-release_6.4-1+ubuntu22.04_all.deb
sudo dpkg -i zabbix-release_6.4-1+ubuntu22.04_all.deb
sudo apt update
Step 2: Install Zabbix Server and Components
# Install Zabbix server, frontend, and agent
sudo apt install zabbix-server-mysql zabbix-frontend-php zabbix-apache-conf zabbix-sql-scripts zabbix-agent

# Install MySQL server
sudo apt install mysql-server
Step 3: Configure Database
# Secure MySQL installation
sudo mysql_secure_installation

# Create Zabbix database and user
sudo mysql -uroot -p

mysql> CREATE DATABASE zabbix CHARACTER SET utf8mb4 COLLATE utf8mb4_bin;
mysql> CREATE USER zabbix@localhost IDENTIFIED BY 'password';
mysql> GRANT ALL PRIVILEGES ON zabbix.* TO zabbix@localhost;
mysql> SET GLOBAL log_bin_trust_function_creators = 1;
mysql> quit;
Step 4: Import Initial Schema
# Import database schema
zcat /usr/share/zabbix-sql-scripts/mysql/server.sql.gz | mysql --default-character-set=utf8mb4 -uzabbix -p zabbix
Step 5: Configure Zabbix Server
Edit the Zabbix server configuration file:
sudo nano /etc/zabbix/zabbix_server.confUpdate the database configuration:
DBPassword=passwordStep 6: Start Services
# Start and enable services
sudo systemctl restart zabbix-server zabbix-agent apache2
sudo systemctl enable zabbix-server zabbix-agent apache2
Installation on CentOS/RHEL 8
Step 1: Install Zabbix Repository
# Install Zabbix repository
sudo rpm -Uvh https://repo.zabbix.com/zabbix/6.4/rhel/8/x86_64/zabbix-release-6.4-1.el8.noarch.rpm
sudo dnf clean all
Step 2: Install Components
# Install Zabbix server, frontend, and agent
sudo dnf install zabbix-server-mysql zabbix-web-mysql zabbix-apache-conf zabbix-sql-scripts zabbix-selinux-policy zabbix-agent

# Install MariaDB
sudo dnf install mariadb-server
Zabbix Agent Configuration
The Zabbix agent is a crucial component for monitoring individual hosts. Here’s how to configure it effectively:
Basic Agent Configuration
Edit the agent configuration file:
sudo nano /etc/zabbix/zabbix_agentd.confKey configuration parameters:
# Zabbix server IP address
Server=192.168.1.100

# Server for active checks
ServerActive=192.168.1.100

# Unique hostname
Hostname=WebServer01

# Metadata for auto-registration
HostMetadata=linux webserver apache

# Enable remote commands (use with caution)
EnableRemoteCommands=0

# Log file location
LogFile=/var/log/zabbix/zabbix_agentd.log

# User items timeout
UserParameterTimeout=30
Custom User Parameters
Create custom monitoring parameters for specific requirements:
# Add custom user parameters
sudo nano /etc/zabbix/zabbix_agentd.d/custom.conf
Example custom parameters:
# Monitor Apache connections
UserParameter=apache.connections,netstat -an | grep :80 | wc -l

# Monitor disk usage for specific mount point
UserParameter=disk.usage[*],df -h $1 | tail -1 | awk '{print $5}' | sed 's/%//'

# Monitor specific service status
UserParameter=service.status[*],systemctl is-active $1 | grep -c active

# Monitor custom log file for errors
UserParameter=log.errors[*],grep -c "ERROR" $1
Web Interface Configuration
Initial Setup
Access the Zabbix web interface at http://your-server-ip/zabbix and complete the setup wizard:
- Welcome Screen: Click “Next step”
- Prerequisites Check: Ensure all requirements are met
- Database Configuration: Enter database details
- Zabbix Server Details: Specify server name and port
- Pre-installation Summary: Review configuration
- Installation Complete: Login with Admin/zabbix
Essential Configuration Steps
1. Change Default Password
Administration → Users → Admin → Change password2. Configure Email Notifications
Set up email media type for notifications:
Administration → Media types → Email → Configure SMTP settings3. Create Host Groups
Configuration → Host groups → Create host groupExample host groups:
- Linux servers
- Web servers
- Database servers
- Network devices
Monitoring Configuration
Adding Hosts for Monitoring
Navigate to Configuration → Hosts → Create host and configure:
Host name: WebServer01
Visible name: Web Server 01
Groups: Linux servers, Web servers
Interfaces: Agent (10.0.1.100:10050)
Templates: Linux by Zabbix agent
Macros: {$MYSQL.PORT} = 3306
Essential Templates
Zabbix provides numerous built-in templates:
- Linux by Zabbix agent: Basic Linux monitoring
- Apache by HTTP: Apache web server monitoring
- MySQL by Zabbix agent: MySQL database monitoring
- NGINX by HTTP: NGINX web server monitoring
- Docker by Zabbix agent 2: Container monitoring
Custom Item Configuration
Create custom monitoring items for specific metrics:
Example: Monitor Website Response Time
Name: Website Response Time
Type: Zabbix agent
Key: web.page.perf[www.example.com]
Type of information: Numeric (float)
Units: s
Update interval: 1m
History storage period: 90d
Example: Monitor Custom Application
Name: Application Process Count
Type: Zabbix agent
Key: proc.num[myapp]
Type of information: Numeric (unsigned)
Update interval: 30s
History storage period: 30d
Trigger Configuration
Triggers define when to generate alerts based on monitored data:
Basic Trigger Examples
High CPU Usage Alert
Name: High CPU usage on {HOST.NAME}
Expression: last(/Linux server/system.cpu.util[,idle])<20
Severity: Warning
Description: CPU usage is above 80% for 5 minutes
Disk Space Alert
Name: Disk space is low on {HOST.NAME}
Expression: last(/Linux server/vfs.fs.size[/,pfree])<10
Severity: High
Description: Available disk space is less than 10%
Service Down Alert
Name: Apache service is down on {HOST.NAME}
Expression: last(/Linux server/proc.num[httpd])=0
Severity: Disaster
Description: Apache web server process is not running
Advanced Monitoring Features
Network Discovery
Configure automatic discovery of network devices:
Configuration → Discovery → Create discovery ruleExample discovery rule configuration:
Name: Local network discovery
IP range: 192.168.1.1-254
Update interval: 1h
Checks: ICMP ping, Zabbix agent, SNMP agent
Device uniqueness criteria: IP address
Host name: DNS name
Low-Level Discovery (LLD)
Automatically discover and monitor filesystem mounts:
Name: Filesystem discovery
Type: Zabbix agent
Key: vfs.fs.discovery
Update interval: 1h
Keep lost resources period: 30d
Web Scenario Monitoring
Monitor web applications and user experience:
Name: Website monitoring
Application: Web monitoring
Update interval: 1m
Retries: 1
Agent: Zabbix
Steps:
  1. Homepage: GET http://www.example.com
  2. Login: POST http://www.example.com/login
  3. Dashboard: GET http://www.example.com/dashboard
Alerting and Notifications
Action Configuration
Create actions to send notifications when triggers activate:
Configuration → Actions → Trigger actions → Create actionEmail Notification Action
Name: Email notifications
Conditions:
  - Trigger severity >= Warning
  - Host group = Linux servers
Operations:
  - Send message to: Admin group
  - Send message via: Email
  - Subject: Problem: {EVENT.NAME}
  - Message: Problem started at {EVENT.TIME}
Recovery operations:
  - Send message: Problem resolved: {EVENT.NAME}
Escalation Configuration
Configure escalation procedures for critical alerts:
Escalation step 1: Send email to admin (0-10 minutes)
Escalation step 2: Send SMS to admin (10-30 minutes)
Escalation step 3: Send email to manager (30+ minutes)
Performance Optimization
Database Optimization
Optimize MySQL/MariaDB for Zabbix:
# Edit MySQL configuration
sudo nano /etc/mysql/mysql.conf.d/mysqld.cnf
Add Zabbix-specific optimizations:
[mysqld]
innodb_buffer_pool_size = 2G
innodb_flush_log_at_trx_commit = 2
innodb_flush_method = O_DIRECT
innodb_log_file_size = 128M
max_connections = 500
query_cache_size = 64M
tmp_table_size = 64M
max_heap_table_size = 64M
Server Performance Tuning
Optimize Zabbix server configuration:
sudo nano /etc/zabbix/zabbix_server.conf# Increase cache sizes
CacheSize=128M
HistoryCacheSize=64M
HistoryIndexCacheSize=32M
TrendCacheSize=32M
# Increase process counts
StartPollers=20
StartPollersUnreachable=5
StartTrappers=10
StartPingers=5
StartDiscoverers=3
StartHTTPPollers=5
# Database connection optimization
DBHost=localhost
DBName=zabbix
DBUser=zabbix
DBPassword=password
DBSocket=/var/run/mysqld/mysqld.sockSecurity Best Practices
Access Control
Implement proper user management:
- Create user groups with specific permissions
- Use least privilege principle for user accounts
- Enable session timeout for inactive users
- Implement strong password policies
Network Security
# Configure firewall rules
sudo ufw allow 80/tcp    # Web interface
sudo ufw allow 443/tcp   # HTTPS
sudo ufw allow 10050/tcp # Zabbix agent
sudo ufw allow 10051/tcp # Zabbix server

# Restrict access to specific IP ranges
sudo ufw allow from 192.168.1.0/24 to any port 10051
SSL/TLS Configuration
Enable HTTPS for web interface:
# Generate SSL certificate
sudo openssl req -x509 -nodes -days 365 -newkey rsa:2048 \
  -keyout /etc/ssl/private/zabbix.key \
  -out /etc/ssl/certs/zabbix.crt

# Configure Apache SSL
sudo nano /etc/apache2/sites-available/zabbix-ssl.conf
Maintenance and Troubleshooting
Log File Analysis
Monitor Zabbix logs for issues:
# Zabbix server logs
sudo tail -f /var/log/zabbix/zabbix_server.log

# Zabbix agent logs
sudo tail -f /var/log/zabbix/zabbix_agentd.log

# Web server logs
sudo tail -f /var/log/apache2/error.log
Database Maintenance
Regular database maintenance tasks:
# Check database size
mysql -uzabbix -p -e "
SELECT table_schema AS 'Database',
ROUND(SUM(data_length + index_length) / 1024 / 1024, 1) AS 'DB Size in MB'
FROM information_schema.tables
WHERE table_schema='zabbix';"

# Optimize tables
mysql -uzabbix -p zabbix -e "OPTIMIZE TABLE history, history_uint, trends, trends_uint;"
Performance Monitoring
Monitor Zabbix internal metrics:
# Check queue status
zabbix_server -R config_cache_reload

# View internal items
Configuration → Hosts → Zabbix server → Items (Internal)
Integration and Automation
API Usage
Automate Zabbix operations using the API:
#!/usr/bin/env python3
import json
import requests

# Zabbix API configuration
ZABBIX_URL = "http://zabbix.example.com/api_jsonrpc.php"
USERNAME = "admin"
PASSWORD = "password"

def zabbix_login():
    data = {
        "jsonrpc": "2.0",
        "method": "user.login",
        "params": {
            "user": USERNAME,
            "password": PASSWORD
        },
        "id": 1
    }

    response = requests.post(ZABBIX_URL,
                           data=json.dumps(data),
                           headers={"Content-Type": "application/json"})

    return response.json()["result"]

# Get authentication token
auth_token = zabbix_login()
print(f"Authentication token: {auth_token}")
Grafana Integration
Enhance visualization by integrating with Grafana:
# Install Grafana
sudo apt-get install -y software-properties-common
sudo add-apt-repository "deb https://packages.grafana.com/oss/deb stable main"
sudo apt-get update
sudo apt-get install grafana

# Install Zabbix plugin for Grafana
grafana-cli plugins install alexanderzobnin-zabbix-app
Conclusion
Zabbix represents a powerful, enterprise-grade monitoring solution that provides comprehensive visibility into your Linux infrastructure. Its flexibility, scalability, and extensive feature set make it an excellent choice for organizations of all sizes. From basic system monitoring to complex distributed environments, Zabbix offers the tools necessary to maintain optimal system performance and reliability.
Success with Zabbix depends on proper planning, configuration, and ongoing maintenance. Start with basic monitoring requirements and gradually expand your monitoring scope as you become more familiar with the platform. Regular review and optimization of your monitoring configuration will ensure you get maximum value from your Zabbix deployment.
Whether you’re monitoring a single server or thousands of devices across multiple locations, Zabbix provides the scalability and functionality to meet your enterprise monitoring needs effectively.
Related Posts
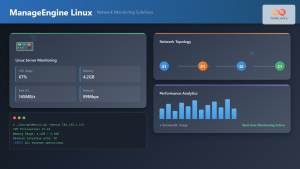
ManageEngine Linux: Complete Network Monitoring Solutions Guide
Network monitoring is crucial for maintaining optimal performance and security in Linux environments. ManageEngine provides powerful network monitoring solutions specifically...
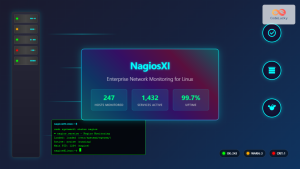
nagiosxi Linux: Complete Enterprise Network Monitoring Guide with Commands and Configuration
NagiosXI represents the pinnacle of enterprise network monitoring solutions on Linux systems, offering comprehensive infrastructure oversight with advanced alerting, reporting,...
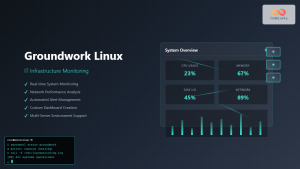
Groundwork Linux: Complete Guide to IT Infrastructure Monitoring and System Health Management
What is Groundwork Linux? Groundwork Linux is a comprehensive open-source IT infrastructure monitoring platform built specifically for Linux environments. It...
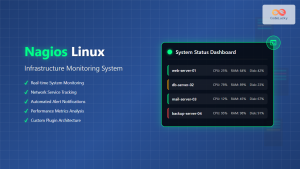
nagios Linux: Complete Infrastructure Monitoring System Setup Guide
Introduction to Nagios Nagios is one of the most popular open-source infrastructure monitoring systems available for Linux environments. Originally developed...
Zenoss Linux: Complete Guide to IT Infrastructure Monitoring and Management
What is Zenoss and Why Use it on Linux? Zenoss is a powerful, open-source IT infrastructure monitoring platform that provides...
thruk Linux: Comprehensive Monitoring Web Interface for Network Infrastructure
Thruk is a powerful web-based monitoring interface designed primarily for Nagios and compatible monitoring systems. As a comprehensive frontend solution,...
Sensu Linux: Complete Monitoring Framework Guide for System Administrators
Sensu is a powerful, open-source monitoring framework designed to monitor servers, services, application health, and business KPIs. Built with modern...
icinga Linux: Complete Network Monitoring System Guide for System Administrators
Icinga is a powerful open-source network monitoring system that helps system administrators monitor network resources, notify users of outages, and...
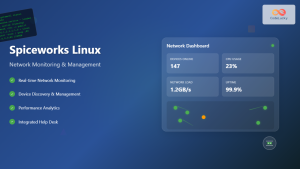
Spiceworks Linux: Complete Network Monitoring and Management Guide
Spiceworks is a powerful, free IT network monitoring and management platform that has revolutionized how system administrators handle their infrastructure....
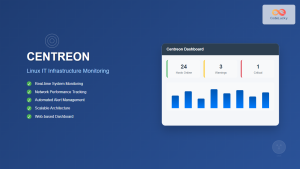
centreon Linux: Complete IT Infrastructure Monitoring Solution Guide
Centreon is a powerful, open-source IT infrastructure monitoring platform built on top of Nagios Core. It provides a comprehensive web-based...
op5 Linux: Complete Network Monitoring Solution Guide
op5 Linux is a comprehensive network monitoring solution built on top of the proven Nagios monitoring engine. This enterprise-grade platform...
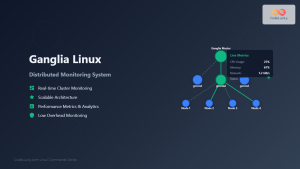
ganglia Linux: Complete Guide to Distributed Monitoring System
Ganglia is a powerful, open-source distributed monitoring system designed specifically for high-performance computing clusters, grids, and cloud infrastructures. Originally developed...


