Wireshark is the world’s most popular network protocol analyzer, providing deep visibility into network traffic and communication protocols. While most users know Wireshark through its graphical interface, Linux systems offer powerful command-line tools that make network analysis more efficient and scriptable.
This comprehensive guide explores Wireshark’s command-line capabilities on Linux, covering installation, core commands, advanced techniques, and real-world troubleshooting scenarios.
What is Wireshark?
Wireshark is a free, open-source packet analyzer that captures and interactively browses network traffic. Originally known as Ethereal, Wireshark has become the de facto standard for network troubleshooting, analysis, software development, and education.
Key Features:
- Live capture and offline analysis
- Support for hundreds of protocols
- Rich VoIP analysis capabilities
- Powerful display filters
- Cross-platform compatibility
- Command-line tools for automation
Installing Wireshark on Linux
Installation varies by Linux distribution. Here are the most common methods:
Ubuntu/Debian:
sudo apt update
sudo apt install wireshark
sudo apt install tshark
CentOS/RHEL/Fedora:
sudo yum install wireshark
# Or for newer versions
sudo dnf install wireshark-cli
Arch Linux:
sudo pacman -S wireshark-qt
sudo pacman -S wireshark-cli
Post-Installation Setup:
After installation, add your user to the wireshark group to capture packets without sudo:
sudo usermod -a -G wireshark $USER
sudo setcap cap_net_raw,cap_net_admin+eip /usr/bin/dumpcap
Note: Log out and back in for group changes to take effect.
Core Wireshark Command-Line Tools
1. TShark – Terminal Wireshark
TShark is the command-line version of Wireshark, perfect for remote analysis and scripting.
Basic Syntax:
tshark [options] [capture-filter]Live Packet Capture:
# Capture packets on default interface
tshark

# Capture on specific interface
tshark -i eth0

# Capture with count limit
tshark -c 100
Example Output:
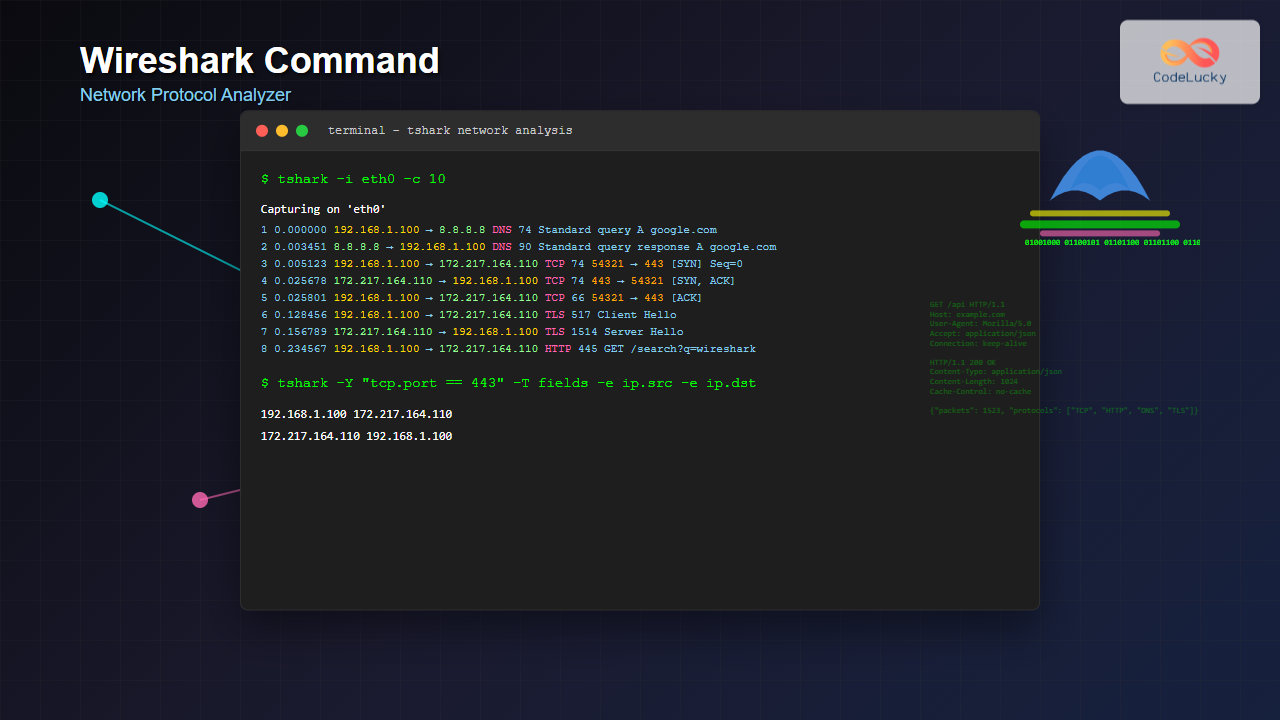
$ tshark -c 5
Capturing on 'eth0'
    1   0.000000 192.168.1.100 → 8.8.8.8      DNS 74 Standard query 0x1234 A google.com
    2   0.003451      8.8.8.8 → 192.168.1.100 DNS 90 Standard query response 0x1234 A google.com A 172.217.164.110
    3   0.005123 192.168.1.100 → 172.217.164.110 TCP 74 54321 → 443 [SYN] Seq=0 Win=65495 Len=0
    4   0.025678 172.217.164.110 → 192.168.1.100 TCP 74 443 → 54321 [SYN, ACK] Seq=0 Ack=1 Win=65160 Len=0
    5   0.025801 192.168.1.100 → 172.217.164.110 TCP 66 54321 → 443 [ACK] Seq=1 Ack=1 Win=65495 Len=0
2. Dumpcap – Lightweight Capture Tool
Dumpcap is optimized for packet capture with minimal overhead.
# Basic capture
dumpcap -i eth0 -w capture.pcap

# Capture with file rotation
dumpcap -i eth0 -b filesize:100000 -w capture.pcap
3. Capinfos – Capture File Information
Displays statistics about capture files:
capinfos capture.pcapExample Output:
File name:           capture.pcap
File type:           Wireshark/tcpdump/... - pcap
File encapsulation:  Ethernet
File timestamp precision: microseconds (6)
Packet size limit:   file hdr: 65535 bytes
Number of packets:   1523
File size:           1,234,567 bytes
Data size:           1,198,432 bytes
Capture duration:    182.456789 seconds
First packet time:   2025-08-25 06:26:15.123456
Last packet time:    2025-08-25 06:29:17.580245
Advanced TShark Usage
Display Filters
Filter packets based on various criteria:
# HTTP traffic only
tshark -f "port 80"

# DNS queries
tshark -Y "dns.qry.name"

# TCP traffic to specific host
tshark -Y "ip.dst == 192.168.1.1 and tcp"

# SSL/TLS handshake
tshark -Y "ssl.handshake.type == 1"
Output Customization
Verbose Output:
tshark -V -c 1Custom Field Output:
# Show specific fields
tshark -T fields -e frame.time -e ip.src -e ip.dst -e tcp.port

# CSV format
tshark -T csv -e ip.src -e ip.dst -e tcp.port
Example Custom Output:
$ tshark -T fields -e frame.time -e ip.src -e ip.dst -e http.request.uri -Y "http.request" -c 3
Aug 25, 2025 06:26:15.123456000 IST	192.168.1.100	172.217.164.110	/search?q=wireshark
Aug 25, 2025 06:26:16.234567000 IST	192.168.1.100	172.217.164.110	/images/logo.png
Aug 25, 2025 06:26:17.345678000 IST	192.168.1.100	172.217.164.110	/api/data.json
Statistics and Analysis
Protocol Hierarchy:
tshark -r capture.pcap -q -z io,phsConversation Statistics:
tshark -r capture.pcap -q -z conv,tcpHTTP Statistics:
tshark -r capture.pcap -q -z http,statPractical Network Analysis Scenarios
Scenario 1: Troubleshooting Slow Website
# Capture HTTP traffic for analysis
tshark -f "port 80 or port 443" -w website_analysis.pcap -c 1000

# Analyze response times
tshark -r website_analysis.pcap -Y "http.response" -T fields -e frame.time_relative -e http.response.code -e http.response_time
Scenario 2: Detecting Network Issues
# Monitor for TCP retransmissions
tshark -Y "tcp.analysis.retransmission" -T fields -e ip.src -e ip.dst -e tcp.analysis.retransmission

# Check for DNS resolution problems
tshark -Y "dns.flags.response == 0" -T fields -e dns.qry.name -e frame.time
Scenario 3: Security Analysis
# Detect suspicious connections
tshark -Y "tcp.flags.syn == 1 and tcp.flags.ack == 0" -T fields -e ip.src -e ip.dst -e tcp.dstport

# Monitor failed authentication attempts
tshark -Y "ssh.message_code == 51" -T fields -e ip.src -e ssh.message_code
File Operations and Management
Reading Capture Files:
# Read from file
tshark -r capture.pcap

# Apply display filter to file
tshark -r capture.pcap -Y "http"

# Extract specific time range
tshark -r capture.pcap -A "2025-08-25 06:26:00" -B "2025-08-25 06:27:00"
Writing Output:
# Save filtered packets
tshark -r input.pcap -Y "tcp.port == 80" -w output.pcap

# Convert to different format
tshark -r capture.pcap -T json > capture.json
File Splitting and Merging:
# Split large file by size
editcap -c 1000 large_capture.pcap split_

# Merge multiple files
mergecap -w merged.pcap file1.pcap file2.pcap file3.pcap
Performance Optimization Tips
1. Use Capture Filters
Apply filters during capture to reduce file size:
# Only capture HTTP traffic
tshark -f "port 80 or port 8080" -w http_only.pcap
2. Ring Buffer Mode
Prevent disk space issues with rotating files:
# Create 5 files of 100MB each
tshark -b filesize:100000 -b files:5 -w capture.pcap
3. Optimize Display Filters
Use specific filters for better performance:
# More specific (faster)
tshark -Y "tcp.port == 80 and ip.addr == 192.168.1.1"

# Less specific (slower)
tshark -Y "tcp and ip"
Automation and Scripting
Bash Script Example:
#!/bin/bash
# Network monitoring script

INTERFACE="eth0"
CAPTURE_FILE="network_monitor_$(date +%Y%m%d_%H%M%S).pcap"
DURATION=3600  # 1 hour

echo "Starting network capture on $INTERFACE"
tshark -i $INTERFACE -a duration:$DURATION -w $CAPTURE_FILE

echo "Analyzing captured data..."
tshark -r $CAPTURE_FILE -q -z io,phs > protocol_stats.txt
tshark -r $CAPTURE_FILE -q -z conv,tcp > tcp_conversations.txt

echo "Analysis complete. Files saved:"
echo "- Capture: $CAPTURE_FILE"
echo "- Protocol stats: protocol_stats.txt"
echo "- TCP conversations: tcp_conversations.txt"
Continuous Monitoring:
# Monitor for specific events
while true; do
    tshark -c 100 -Y "icmp.type == 8" -T fields -e ip.src -e icmp.seq | \
    while read src seq; do
        echo "$(date): PING from $src, sequence $seq"
    done
    sleep 1
done
Common Troubleshooting Issues
Permission Problems:
# If you get permission errors
sudo tshark -i eth0

# Or fix permissions permanently
sudo usermod -a -G wireshark $USER
sudo setcap cap_net_raw,cap_net_admin+eip /usr/bin/dumpcap
Interface Selection:
# List available interfaces
tshark -D

# Capture on all interfaces
tshark -i any
Large File Handling:
# Process large files in chunks
tshark -r large_file.pcap -c 1000 -Y "your_filter" > chunk1.txt
Security Considerations
Important: Network packet capture involves sensitive data. Always ensure:
- You have proper authorization before capturing network traffic
- Captured files are stored securely and encrypted if necessary
- Access to capture capabilities is restricted to authorized personnel
- Compliance with organizational and legal privacy requirements
Best Practices
1. Plan Your Capture Strategy
- Define what you need to capture before starting
- Use appropriate filters to minimize data volume
- Set time limits or file size limits
2. Organize Your Files
- Use descriptive filenames with timestamps
- Create separate directories for different projects
- Document your capture parameters
3. Regular Maintenance
- Clean up old capture files regularly
- Archive important captures with proper metadata
- Update Wireshark regularly for latest protocol support
Conclusion
Wireshark’s command-line tools provide powerful capabilities for network analysis on Linux systems. From basic packet capture with TShark to advanced automation scripts, these tools enable network administrators and security professionals to gain deep insights into network behavior.
Whether you’re troubleshooting connectivity issues, analyzing security threats, or optimizing network performance, mastering Wireshark’s command-line interface will significantly enhance your network analysis capabilities. Start with basic captures and gradually incorporate more advanced techniques as you become comfortable with the tools.
Remember to always respect privacy and security requirements when capturing network traffic, and use these powerful tools responsibly in your network analysis endeavors.

