
The watch command is one of the most powerful utilities in Linux for executing commands repeatedly at regular intervals and displaying their output in real-time. This essential tool allows system administrators and developers to monitor system processes, track file changes, observe network statistics, and automate repetitive tasks without manual intervention.
Understanding the watch Command
The watch command runs a specified command periodically and displays its output on the terminal screen. By default, it executes the command every 2 seconds, refreshing the display to show updated results. This makes it invaluable for monitoring system resources, tracking log files, or observing any dynamic data that changes over time.
Basic Syntax
watch [options] commandThe command structure is straightforward: you specify any options you want to use, followed by the command you want to execute repeatedly.
Essential watch Command Options
Interval Control (-n)
The -n option allows you to specify the interval between command executions in seconds:
watch -n 5 dateThis example executes the date command every 5 seconds instead of the default 2 seconds.
Highlight Differences (-d)
The -d option highlights the differences between successive updates, making it easier to spot changes:
watch -d 'ps aux | head -10'Changes in the process list will be highlighted, helping you identify which processes have started or stopped.
Beep on Errors (-b)
Use the -b option to make the terminal beep when the command exits with a non-zero status:
watch -b 'ping -c 1 google.com'This will beep if the ping command fails, alerting you to network connectivity issues.
Exit on Changes (-g)
The -g option makes watch exit when the output changes:
watch -g 'ls -l /tmp/myfile'This command will exit as soon as the file’s properties change, useful for monitoring file modifications.
Precise Timing (-p)
The -p option attempts to run the command at precise intervals:
watch -p -n 0.1 dateThis tries to execute the command exactly every 0.1 seconds, useful for high-frequency monitoring.
Practical Examples and Use Cases
System Resource Monitoring
Monitor system memory usage in real-time:
watch -n 1 'free -h'Expected Output:
Every 1.0s: free -h                                     Mon Aug 25 06:53:21 2025

               total        used        free      shared  buff/cache   available
Mem:           7.7Gi       2.1Gi       3.8Gi       234Mi       1.8Gi       5.2Gi
Swap:          2.0Gi          0B       2.0Gi
Watch CPU usage with top:
watch -n 2 'top -bn1 | head -20'Network Monitoring
Monitor network connections:
watch -n 3 'netstat -tuln | grep LISTEN'Track network interface statistics:
watch -d 'cat /proc/net/dev'Expected Output:
Every 2.0s: cat /proc/net/dev                          Mon Aug 25 06:53:21 2025

Inter-|   Receive                                                |  Transmit
 face |bytes    packets errs drop fifo frame compressed multicast|bytes    packets errs drop fifo colls carrier compressed
    lo:    1234      15    0    0    0     0          0         0     1234      15    0    0    0     0       0          0
  eth0: 1234567    8901    0    0    0     0          0      1234  9876543    7654    0    0    0     0       0          0
File System Monitoring
Watch disk usage:
watch -n 5 'df -h'Monitor directory contents for changes:
watch -d 'ls -la /var/log/'Track file size changes:
watch -n 1 'du -sh /path/to/directory'Process Monitoring
Monitor specific processes:
watch -n 2 'ps aux | grep apache'Track process count:
watch 'ps aux | wc -l'Expected Output:
Every 2.0s: ps aux | wc -l                             Mon Aug 25 06:53:21 2025

      127
Log File Monitoring
Watch the last few lines of a log file:
watch -n 1 'tail -10 /var/log/syslog'Monitor error logs:
watch -d 'tail -5 /var/log/error.log'Advanced watch Command Techniques
Using Complex Commands with Pipes
When using complex commands with pipes, quotes are essential:
watch -n 3 'ps aux | grep -v grep | grep python | wc -l'This counts the number of Python processes running on the system.
Monitoring Multiple Commands
You can monitor multiple commands by combining them:
watch -n 2 'echo "=== Memory Usage ==="; free -h; echo; echo "=== Disk Usage ==="; df -h | head -5'Conditional Monitoring
Use conditional statements within watch:
watch -n 5 'if pgrep nginx > /dev/null; then echo "Nginx is running"; else echo "Nginx is NOT running"; fi'Customizing watch Output
Removing Headers (-t)
Use the -t option to remove the header information:
watch -t -n 1 dateThis displays only the command output without the timestamp and command information at the top.
Color Output (-c)
Preserve color output from commands:
watch -c -n 1 'ls --color=always'Performance Considerations
When using the watch command, consider these performance aspects:
- Interval Selection: Choose appropriate intervals. Very short intervals (less than 1 second) can consume significant CPU resources.
- Command Complexity: Complex commands with heavy processing should use longer intervals to avoid system overload.
- Resource Usage: Monitor the resource usage of both the watch command and the monitored command.
Common Pitfalls and Solutions
Quoting Issues
Always use quotes when your command contains special characters or pipes:
# Incorrect
watch ps aux | grep nginx

# Correct
watch 'ps aux | grep nginx'
Terminal Size Limitations
If your command output is too wide for the terminal, consider filtering or formatting:
watch -n 2 'ps aux | cut -c1-80'Handling Long-Running Commands
For commands that take longer than the watch interval, consider increasing the interval:
watch -n 10 'find / -name "*.log" -size +100M'Combining watch with Other Tools
Using with grep for Filtering
watch -d 'ps aux | grep -E "(apache|nginx|mysql)"'Integration with awk for Processing
watch -n 5 'free | awk "/^Mem:/ {printf \"Memory Usage: %.2f%%\n\", \$3/\$2 * 100.0}"'Combining with sort for Organized Output
watch -n 3 'ps aux --sort=-%cpu | head -10'Real-World Scenarios
Database Connection Monitoring
watch -n 5 'mysql -e "SHOW PROCESSLIST;" | wc -l'Web Server Status Monitoring
watch -n 10 'curl -s -o /dev/null -w "%{http_code}" http://localhost && echo " - Server responding"'Backup Progress Monitoring
watch -n 30 'du -sh /backup/directory/'Troubleshooting Common Issues
Command Not Found Errors
Ensure the command exists and is in your PATH:
watch -n 2 'which python3 && python3 --version'Permission Issues
Some commands may require elevated privileges:
sudo watch -n 3 'netstat -tulnp'Output Truncation
If output is being truncated, try adjusting your terminal size or filtering the output.
Best Practices
- Use appropriate intervals: Balance between real-time monitoring and system performance
- Implement proper quoting: Always quote complex commands to prevent shell interpretation issues
- Monitor resource usage: Keep track of CPU and memory usage when running watch
- Use meaningful intervals: Match the interval to the rate of change you expect
- Combine with other tools: Leverage pipes and command combinations for powerful monitoring solutions
The watch command is an indispensable tool for Linux system administration and development workflows. Its ability to provide real-time monitoring of system resources, processes, and files makes it essential for maintaining system health, debugging issues, and automating repetitive monitoring tasks. By mastering its various options and understanding how to combine it with other Linux commands, you can create powerful monitoring solutions tailored to your specific needs.
Related Posts
w Command Linux: Complete Guide to Monitor Active Users and System Activity
The w command is one of the most essential system monitoring tools in Linux, providing administrators and users with real-time...

top Command Linux: Complete Guide to Real-Time Process Monitoring
The top command is one of the most essential tools in a Linux system administrator's arsenal. It provides real-time information...
htop Command Linux: Complete Guide to Advanced Process Monitoring and Management
The htop command is an enhanced, interactive version of the traditional top command that provides real-time monitoring of system processes...
ps Command in Linux: Complete Guide to Process Monitoring and Management
The ps command is one of the most fundamental and powerful tools in Linux for displaying information about running processes....
uptime Command Linux: Complete Guide to System Uptime and Load Average Monitoring
The uptime command is one of the most fundamental system monitoring tools in Linux, providing essential information about how long...
inotifywait Command Linux: Complete Guide to Real-Time File System Monitoring
The inotifywait command is a powerful Linux utility that enables real-time monitoring of file system events. Whether you're tracking file...
at Command Linux: Complete Guide to Schedule One-time Tasks with Examples
The at command in Linux is a powerful utility for scheduling one-time tasks to run at specific times in the...
logger Command Linux: Complete Guide to System Log Message Management
The logger command in Linux is a powerful utility that allows users and scripts to send messages directly to the...
tail Command Linux: Complete Guide to Display Last Lines and Follow Logs in Real-Time
The tail command is one of the most essential tools in Linux for displaying the last lines of files and...
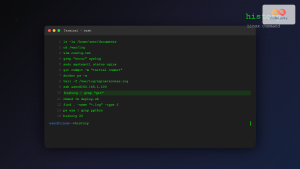
history Command Linux: Complete Guide to View and Manage Your Command History
The history command in Linux is one of the most powerful tools for managing and navigating your command line experience....
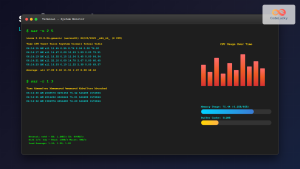
sar Command Linux: System Activity Reporter for Performance Monitoring
The sar (System Activity Reporter) command is one of the most powerful and comprehensive system monitoring tools available in Linux....
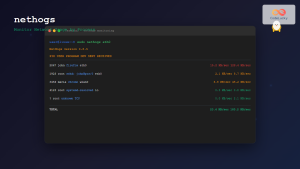
nethogs Command Linux: Monitor Real-Time Network Usage by Process
Network monitoring is a crucial aspect of system administration, especially when you need to identify which processes are consuming bandwidth...


