
The w command is one of the most essential system monitoring tools in Linux, providing administrators and users with real-time information about who is currently logged into the system and what they’re doing. Unlike basic commands that show limited user information, w offers comprehensive insights into system load, uptime, and detailed user activity.
What is the w Command?
The w command displays information about currently logged-in users and their activities. It combines the functionality of several commands like uptime, who, and ps to provide a complete overview of system status and user sessions in a single output.
Basic Syntax and Usage
The basic syntax of the w command is straightforward:
w [options] [user]When executed without any arguments, w displays information for all logged-in users:
$ wSample Output:
 14:23:45 up 2 days,  3:42,  3 users,  load average: 0.15, 0.23, 0.18
USER     TTY      FROM             LOGIN@   IDLE   JCPU   PCPU WHAT
john     pts/0    192.168.1.100    13:45    2.00s  0.12s  0.01s ssh user@remote-server
alice    pts/1    192.168.1.101    14:20    0.00s  0.05s  0.02s vi /home/alice/project.txt
bob      console  -                09:30   4:53m  1.23s  0.45s /usr/bin/gnome-session
Understanding the Output
Header Information
The first line contains system-wide information:
- Current Time: 14:23:45 – The current system time
- Uptime: up 2 days, 3:42 – How long the system has been running
- Users: 3 users – Number of currently logged-in users
- Load Average: 0.15, 0.23, 0.18 – System load averages for 1, 5, and 15 minutes
User Information Columns
Each subsequent line shows details for individual users:
- USER: Username of the logged-in user
- TTY: Terminal type (pts/0 for pseudo-terminal, console for direct login)
- FROM: IP address or hostname from where the user connected
- LOGIN@: Time when the user logged in
- IDLE: Time since the user’s last activity
- JCPU: Total CPU time used by all processes in the session
- PCPU: CPU time used by the current process
- WHAT: Current command or process being executed
Command Options and Flags
Display Information for Specific User
To view information for a specific user:
$ w johnOutput:
 14:25:30 up 2 days,  3:44,  1 user,  load average: 0.12, 0.20, 0.16
USER     TTY      FROM             LOGIN@   IDLE   JCPU   PCPU WHAT
john     pts/0    192.168.1.100    13:45    1.30s  0.15s  0.01s top
Short Format (-s)
The -s option provides a shorter, more compact output:
$ w -sOutput:
 14:26:15 up 2 days,  3:45,  3 users,  load average: 0.08, 0.18, 0.15
USER     TTY      FROM              IDLE WHAT
john     pts/0    192.168.1.100     2.00s ssh user@remote-server
alice    pts/1    192.168.1.101     0.00s vi /home/alice/project.txt
bob      console  -                4:58m /usr/bin/gnome-session
No Header (-h)
To suppress the header line and show only user information:
$ w -hOutput:
john     pts/0    192.168.1.100    13:45    3.00s  0.18s  0.01s ssh user@remote-server
alice    pts/1    192.168.1.101    14:20    0.00s  0.08s  0.02s vi /home/alice/project.txt
bob      console  -                09:30   5:02m  1.28s  0.45s /usr/bin/gnome-session
Show Full Process Names (-f)
The -f option toggles the display of the FROM field:
$ w -fCombining Options
You can combine multiple options for customized output:
$ w -hs aliceOutput:
alice pts/1 192.168.1.101 0.00s vi /home/alice/project.txtPractical Use Cases
System Administration
System administrators frequently use the w command for:
- Monitoring User Activity: Track what users are doing on the system
- Security Auditing: Identify unauthorized access or suspicious activities
- Resource Management: Monitor system load and user resource consumption
- Session Management: Determine active sessions before maintenance
Example: Security Monitoring
$ w | grep -E "(pts|ssh)"This command filters for remote connections, helping identify external access:
john     pts/0    203.0.113.45     13:45    0.00s  0.20s  0.01s ssh production-server
alice    pts/1    198.51.100.10    14:20    2.00s  0.12s  0.03s mysql -u admin -p
Example: Load Monitoring Script
Create a simple monitoring script:
#!/bin/bash
# monitor.sh - Simple system monitoring

echo "=== System Status ==="
w -h | head -1 | awk '{print "Load Average: " $10 " " $11 " " $12}'
echo "Active Users: $(w -h | wc -l)"
echo ""
echo "=== User Activity ==="
w -s
Differences from Similar Commands
w vs who
While who shows basic login information, w provides more comprehensive details:
$ who
john     pts/0        2025-08-25 13:45 (192.168.1.100)
alice    pts/1        2025-08-25 14:20 (192.168.1.101)
$ w -h
john pts/0 192.168.1.100 13:45 1.00s 0.25s 0.01s bash
alice pts/1 192.168.1.101 14:20 0.00s 0.15s 0.02s python script.pyw vs uptime
The uptime command shows only system load information, while w includes user details:
$ uptime
 14:30:00 up 2 days,  3:49,  3 users,  load average: 0.10, 0.15, 0.12
Advanced Usage and Tips
Filtering and Processing Output
Combine w with other commands for advanced filtering:
# Show users idle for more than 1 hour
$ w | awk '$5 ~ /[0-9]+:[0-9]+m/ && $5 > "1:00m" {print $1, $5}'

# Count users by connection type
$ w -h | awk '{print $2}' | sort | uniq -c

# Show high CPU usage sessions
$ w -h | awk '$6+0 > 1.0 {print $1, $6, $8}'
Monitoring Remote Connections
Identify and monitor remote SSH connections:
$ w | grep -v "console\|-" | grep -E "pts/[0-9]+"Real-time Monitoring
Use watch command for continuous monitoring:
$ watch -n 5 'w'This refreshes the w output every 5 seconds, providing real-time user activity monitoring.
Troubleshooting and Common Issues
Permission Issues
The w command generally works for all users, but some information might be limited based on permissions:
$ w
w: cannot read /var/run/utmp: Permission denied
This typically indicates file permission issues that require administrator attention.
Empty or Minimal Output
If w shows minimal information, it might be due to:
- No other users logged in
- System running in single-user mode
- Issues with utmp/wtmp files
Security Considerations
When using the w command in security-sensitive environments:
- Regular Monitoring: Check for unauthorized access regularly
- Log Analysis: Combine with log files for comprehensive security auditing
- Automated Alerts: Create scripts to alert on suspicious activities
- Access Control: Limit command access in high-security environments
Best Practices
- Regular Monitoring: Include
win routine system checks - Script Integration: Incorporate into monitoring and alerting scripts
- Documentation: Document normal usage patterns for comparison
- Combination Usage: Use with other commands for comprehensive monitoring
- Automated Reporting: Schedule regular reports using
woutput
Conclusion
The w command is an indispensable tool for Linux system administration and monitoring. It provides comprehensive information about user activities, system load, and session details in a single, easy-to-read format. Whether you’re monitoring system security, managing resources, or troubleshooting performance issues, mastering the w command will significantly enhance your Linux administration capabilities.
By understanding its various options and combining it with other Linux commands, you can create powerful monitoring solutions that keep your systems secure and well-maintained. Regular use of the w command helps maintain awareness of system activity and ensures optimal performance and security.
Related Posts
who Command in Linux: Complete Guide to Display Logged in Users
The who command is one of the most fundamental system administration tools in Linux, designed to display information about currently...
htop Command Linux: Complete Guide to Advanced Process Monitoring and Management
The htop command is an enhanced, interactive version of the traditional top command that provides real-time monitoring of system processes...
ps Command in Linux: Complete Guide to Process Monitoring and Management
The ps command is one of the most fundamental and powerful tools in Linux for displaying information about running processes....
watch Command Linux: Monitor and Execute Commands Repeatedly in Real-Time
The watch command is one of the most powerful utilities in Linux for executing commands repeatedly at regular intervals and...

top Command Linux: Complete Guide to Real-Time Process Monitoring
The top command is one of the most essential tools in a Linux system administrator's arsenal. It provides real-time information...

uptime Command Linux: Complete Guide to System Uptime and Load Average Monitoring
The uptime command is one of the most fundamental system monitoring tools in Linux, providing essential information about how long...
last Command Linux: Display Login History and System Boot Records
The last command is an essential Linux utility that displays a chronological list of user logins, system boots, and shutdowns...
logger Command Linux: Complete Guide to System Log Message Management
The logger command in Linux is a powerful utility that allows users and scripts to send messages directly to the...
loginctl Command Linux: Master Session Management with Practical Examples
The loginctl command is a powerful systemd utility that allows system administrators to introspect and control the systemd login manager...

free Command in Linux: Monitor Memory Usage and Swap Space Efficiently
The free command is one of the most essential utilities in Linux for monitoring system memory usage and swap space....
sar Command Linux: System Activity Reporter for Performance Monitoring
The sar (System Activity Reporter) command is one of the most powerful and comprehensive system monitoring tools available in Linux....
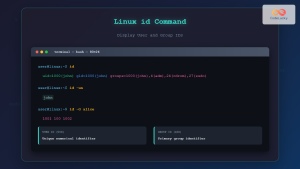
id Command Linux: Complete Guide to Display User and Group IDs
The id command is a fundamental Linux utility that displays user and group identification information for the current user or...


