
Network traffic monitoring is a crucial aspect of system administration, and the vnstat command in Linux provides an elegant solution for tracking network usage statistics. This lightweight, console-based tool offers comprehensive insights into your network interface traffic patterns without consuming significant system resources.
What is vnstat Command?
The vnstat command is a network traffic monitor that keeps track of network usage for selected network interfaces. Unlike other monitoring tools that require constant running processes, vnstat works by reading kernel-provided network statistics and storing them in a database for historical analysis. This approach makes it extremely efficient and suitable for long-term monitoring.
Key Features of vnstat
- Low resource consumption – Minimal CPU and memory usage
- Historical data – Maintains long-term statistics
- Multiple time periods – Hourly, daily, weekly, and monthly views
- Multiple interfaces – Monitor several network interfaces simultaneously
- Database storage – Persistent data across reboots
- JSON output – Machine-readable format for integration
Installing vnstat on Linux
The installation process varies depending on your Linux distribution. Here are the most common methods:
Ubuntu/Debian Systems
sudo apt update
sudo apt install vnstat
CentOS/RHEL/Fedora Systems
# For CentOS/RHEL
sudo yum install vnstat

# For Fedora
sudo dnf install vnstat
Arch Linux
sudo pacman -S vnstatInitial Setup and Configuration
After installation, you need to initialize the database and start the vnstat daemon:
Initialize Database
# Initialize database for default interface (usually eth0 or ens33)
sudo vnstat -i eth0 --create

# Start and enable the vnstat service
sudo systemctl start vnstat
sudo systemctl enable vnstat
Configuration File
The main configuration file is located at /etc/vnstat.conf. Key configuration options include:
# Database directory
DatabaseDir "/var/lib/vnstat"

# Update interval (seconds)
UpdateInterval 30

# Save interval (minutes)
SaveInterval 5

# Interface monitoring
Interface "eth0"
Basic vnstat Command Usage
Let’s explore the fundamental usage of vnstat with practical examples:
Display Current Statistics
vnstatSample Output:
Database updated: 2025-08-26 04:30:01

   eth0 since 2025-08-01

          rx:  2.45 GiB      tx:  1.23 GiB      total:  3.68 GiB

                     rx      |     tx      |    total    |   avg. rate
     ------------------------+-------------+-------------+---------------
       yesterday     45.2 MiB |   23.1 MiB |   68.3 MiB |    0.79 kbit/s
           today    123.4 MiB |   67.8 MiB |  191.2 MiB |    1.42 kbit/s
     ------------------------+-------------+-------------+---------------
     estimated       156 MiB |    85 MiB |   241 MiB |
Specify Network Interface
vnstat -i wlan0Display Hourly Statistics
vnstat -hSample Output:
 eth0                                                                     04:30
  ^
  |
  |    r
  |    x   r
  |    |   x
  | t  |t  |
  | x  |x  |
  | |  ||  |  r
  | |  ||  |  x
  +-+--++--+--+---+---+---+---+---+---+---+---+---+---+---+---+---+---+---+
   00 01 02 03 04 05 06 07 08 09 10 11 12 13 14 15 16 17 18 19 20 21 22 23

 h  rx (MiB)   tx (MiB)      h  rx (MiB)   tx (MiB)      h  rx (MiB)   tx (MiB)
00      12.4       6.7     08       0.0       0.0     16       0.0       0.0
01      15.2       8.1     09       0.0       0.0     17       0.0       0.0
02      18.7       9.3     10       0.0       0.0     18       0.0       0.0
03      21.1      11.2     11       0.0       0.0     19       0.0       0.0
Advanced vnstat Command Options
Daily Statistics
vnstat -dThis displays daily network usage for the current month with a calendar-like view.
Weekly Statistics
vnstat -wMonthly Statistics
vnstat -mSample Monthly Output:
 eth0  /  monthly

       month        rx      |     tx      |    total    |   avg. rate
     ------------------------+-------------+-------------+---------------
      2025-06      1.25 GiB |  642.3 MiB |    1.87 GiB |   0.73 kbit/s
      2025-07      2.14 GiB |    1.12 GiB |    3.26 GiB |   1.28 kbit/s
      2025-08      3.45 GiB |    1.78 GiB |    5.23 GiB |   2.05 kbit/s
     ------------------------+-------------+-------------+---------------
     estimated      4.12 GiB |    2.13 GiB |    6.25 GiB |
Top 10 Traffic Days
vnstat -tLive Traffic Monitoring
vnstat -lThis provides real-time traffic monitoring. Press Ctrl+C to stop.
Sample Live Output:
Monitoring eth0...    (press CTRL-C to stop)

   rx:        2.34 kbit/s     8 p/s          tx:        1.67 kbit/s     6 p/s
   rx:        3.45 kbit/s    12 p/s          tx:        2.12 kbit/s     8 p/s
   rx:        1.89 kbit/s     5 p/s          tx:        1.23 kbit/s     4 p/s
JSON Output Format
For automation and integration purposes, vnstat supports JSON output:
vnstat --jsonSample JSON Output:
{
    "vnstatversion": "2.6",
    "jsonversion": "1",
    "interfaces": [
        {
            "name": "eth0",
            "alias": "",
            "created": {
                "date": {
                    "year": 2025,
                    "month": 8,
                    "day": 1
                }
            },
            "updated": {
                "date": {
                    "year": 2025,
                    "month": 8,
                    "day": 26
                },
                "time": {
                    "hour": 4,
                    "minute": 30
                }
            },
            "traffic": {
                "total": {
                    "rx": 2636046336,
                    "tx": 1320157184
                },
                "days": [
                    {
                        "date": {
                            "year": 2025,
                            "month": 8,
                            "day": 25
                        },
                        "rx": 47472640,
                        "tx": 24235008
                    }
                ]
            }
        }
    ]
}
Managing Multiple Network Interfaces
Add New Interface to Monitoring
sudo vnstat -i wlan0 --createList All Monitored Interfaces
vnstat --iflistRemove Interface from Monitoring
sudo vnstat -i wlan0 --deleteCustomizing Output
Specify Date Range
# Show data for specific date
vnstat -i eth0 -d --begin 2025-08-01 --end 2025-08-25
Change Units
# Display in different units
vnstat --style 0  # Adaptive units
vnstat --style 1  # Bytes
vnstat --style 2  # Bits
Limit Output Lines
# Show only last 5 days
vnstat -d -l 5
Database Management
Database Information
vnstat --dbdirExport Database
vnstat --exportdb > network_stats_backup.dbImport Database
vnstat --importdb < network_stats_backup.dbPractical Use Cases
Bandwidth Usage Monitoring
Create a script to monitor daily bandwidth usage and send alerts:
#!/bin/bash
# Check if daily usage exceeds 1GB
USAGE=$(vnstat --json -d | jq '.interfaces[0].traffic.days[-1].rx + .interfaces[0].traffic.days[-1].tx')
LIMIT=1073741824  # 1GB in bytes

if [ $USAGE -gt $LIMIT ]; then
    echo "Daily bandwidth limit exceeded: $(($USAGE / 1024 / 1024)) MB used"
fi
Monthly Report Generation
# Generate monthly HTML report
vnstat -i eth0 -m --xml > monthly_report.xml
Troubleshooting Common Issues
Interface Not Found Error
If you encounter “interface not found” errors:
# List available interfaces
ip link show

# Verify interface name and create database
sudo vnstat -i correct_interface_name --create
Permission Issues
For permission-related problems:
# Check database permissions
ls -la /var/lib/vnstat/

# Fix permissions if needed
sudo chown vnstat:vnstat /var/lib/vnstat/*
Service Not Running
# Check service status
systemctl status vnstat

# Restart if needed
sudo systemctl restart vnstat
Integration with Other Tools
Combining with awk for Custom Reports
# Extract total monthly usage
vnstat -m | awk '/total/ {print $5, $7, $9}'
Creating Graphs with vnstati
Install vnstati for graphical output:
sudo apt install vnstati

# Generate hourly graph
vnstati -h -i eth0 -o hourly_traffic.png
Best Practices
- Regular backups – Export database regularly for data protection
- Monitor multiple interfaces – Include all active network interfaces
- Set up alerts – Create scripts to notify about unusual traffic patterns
- Use JSON output – For automated processing and integration
- Regular maintenance – Clean old data if disk space is limited
Performance Considerations
vnstat is designed to be lightweight, but consider these optimization tips:
- Adjust
UpdateIntervalin configuration for less frequent updates if needed - Use
SaveIntervalto control how often data is written to disk - Monitor database size and implement rotation if necessary
- Consider using
--limitoptions to reduce output size for scripting
Conclusion
The vnstat command is an indispensable tool for Linux system administrators and users who need to monitor network traffic efficiently. Its lightweight design, comprehensive features, and flexible output formats make it perfect for both real-time monitoring and historical analysis. Whether you’re tracking bandwidth usage, generating reports, or integrating with automated systems, vnstat provides the reliability and functionality needed for effective network monitoring.
By mastering vnstat’s various options and features, you can gain valuable insights into your network usage patterns, helping you make informed decisions about bandwidth management, capacity planning, and network optimization. The tool’s simplicity combined with its powerful capabilities makes it a must-have utility in any Linux administrator’s toolkit.
Related Posts

iptraf Command Linux: Complete Interactive Network Monitoring Guide
The iptraf command is a powerful console-based network monitoring utility for Linux systems that provides real-time IP LAN monitoring capabilities....
iftop Command Linux: Monitor Network Traffic and Display Bandwidth Usage by Connection
The iftop command is a powerful network monitoring tool in Linux that displays real-time bandwidth usage by network connections. Similar...
nethogs Command Linux: Monitor Real-Time Network Usage by Process
Network monitoring is a crucial aspect of system administration, especially when you need to identify which processes are consuming bandwidth...
nload Command Linux: Complete Guide to Monitor Network Traffic and Bandwidth in Real-Time
The nload command is a powerful Linux utility that provides real-time monitoring of network traffic and bandwidth usage. Unlike basic...
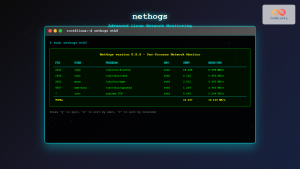
nethogs Advanced Linux: Complete Guide to Per-Process Network Monitoring
Network monitoring is crucial for system administrators and developers who need to track bandwidth usage and identify network-intensive processes. While...
ntopng Command Linux: Complete Guide to Web-Based Network Traffic Monitoring
Network traffic monitoring is crucial for maintaining optimal network performance, security, and troubleshooting connectivity issues. The ntopng command provides a...
bmon Command Linux: Complete Guide to Real-Time Bandwidth Monitoring and Network Analysis
The bmon (Bandwidth Monitor) command is a powerful Linux utility designed for real-time network bandwidth monitoring and rate estimation. This...
jnettop Command Linux: Monitor Real-Time Network Traffic by Connection
The jnettop command is a powerful Linux network monitoring tool that provides real-time visibility into network traffic organized by individual...
netstat Command Linux: Complete Guide to Network Connection Monitoring
The netstat command is one of the most essential network monitoring tools in Linux systems. It provides comprehensive information about...
slurm Command Linux: Real-Time Network Traffic Monitor and Bandwidth Analyzer
The slurm command is a powerful network monitoring tool for Linux systems that provides real-time visualization of network traffic and...

Paessler Linux: Complete Guide to Network Monitoring with PRTG on Linux Systems
Network monitoring is crucial for maintaining optimal performance and security in Linux environments. Paessler PRTG Network Monitor offers comprehensive monitoring...

cbm Command Linux: Monitor Network Bandwidth in Real-Time with Color Display
The cbm (Color Bandwidth Meter) command is a powerful Linux utility that provides real-time monitoring of network bandwidth usage with...


