The vmstat command is one of the most powerful and essential tools for Linux system administrators and developers to monitor virtual memory statistics and overall system performance. This comprehensive guide will walk you through everything you need to know about using vmstat effectively to diagnose system bottlenecks, monitor resource utilization, and optimize your Linux systems.
What is vmstat Command?
vmstat (Virtual Memory Statistics) is a built-in Linux command that reports information about processes, memory, paging, block I/O, traps, and CPU activity. It provides a snapshot of system performance metrics and can run continuously to monitor system behavior over time.
The vmstat command displays crucial system statistics including:
- Virtual memory usage and statistics
- CPU utilization breakdown
- Process information (running, blocked, sleeping)
- Memory statistics (free, used, cached, buffered)
- I/O statistics (blocks read/written)
- System interrupts and context switches
vmstat Command Syntax
The basic syntax of vmstat command is:
vmstat [options] [delay [count]]Parameters explained:
delay: Time interval (in seconds) between updatescount: Number of updates to display before exitingoptions: Various flags to modify output format
Basic vmstat Usage Examples
1. Display Current System Statistics
Run vmstat without any parameters to see current system statistics:
vmstatSample Output:
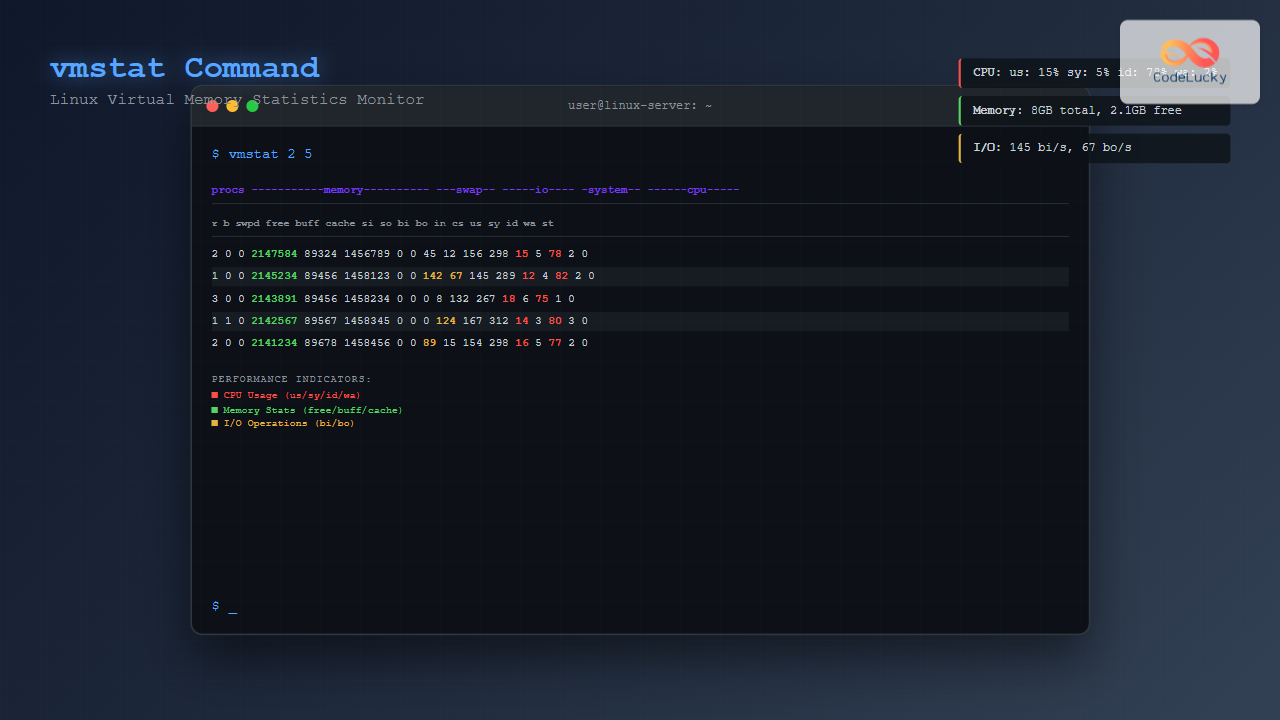
procs -----------memory---------- ---swap-- -----io---- -system-- ------cpu-----
 r  b   swpd   free   buff  cache   si   so    bi    bo   in   cs us sy id wa st
 2  0      0 1847564  89324 1456789    0    0    45    12  156  298  8  2 89  1  0
2. Monitor System Continuously
Display statistics every 2 seconds:
vmstat 2Display statistics every 5 seconds for 10 iterations:
vmstat 5 10Sample Continuous Output:
procs -----------memory---------- ---swap-- -----io---- -system-- ------cpu-----
 r  b   swpd   free   buff  cache   si   so    bi    bo   in   cs us sy id wa st
 1  0      0 1845234  89456 1458123    0    0    42    15  145  289  7  2 90  1  0
 0  0      0 1843891  89456 1458234    0    0     0     8  132  267  5  1 94  0  0
 2  0      0 1842567  89567 1458345    0    0     0    12  167  312  9  3 88  0  0
Understanding vmstat Output Columns
Process (procs) Section
- r: Number of runnable processes (running or waiting for CPU)
- b: Number of processes in uninterruptible sleep (blocked)
Memory Section
- swpd: Virtual memory used (KB)
- free: Free/idle memory (KB)
- buff: Memory used as buffers (KB)
- cache: Memory used as cache (KB)
Swap Section
- si: Memory swapped from disk (KB/s)
- so: Memory swapped to disk (KB/s)
I/O Section
- bi: Blocks received from block devices (blocks/s)
- bo: Blocks sent to block devices (blocks/s)
System Section
- in: Interrupts per second
- cs: Context switches per second
CPU Section
- us: User CPU time percentage
- sy: System CPU time percentage
- id: Idle CPU time percentage
- wa: I/O wait time percentage
- st: Time stolen from VM (virtualization)
Advanced vmstat Options
1. Display Memory Statistics in Different Units
Show statistics in megabytes:
vmstat -S MSample Output:
procs -----------memory---------- ---swap-- -----io---- -system-- ------cpu-----
 r  b   swpd   free   buff  cache   si   so    bi    bo   in   cs us sy id wa st
 1  0      0   1803     87   1423    0    0    45    12  156  298  8  2 89  1  0
2. Display Detailed Memory Statistics
Use the -s option to display detailed memory statistics:
vmstat -sSample Output:
      4048532 K total memory
       389456 K used memory
       567234 K active memory
       234567 K inactive memory
      1847564 K free memory
        89324 K buffer memory
      1456789 K swap cache
      2097148 K total swap
            0 K used swap
      2097148 K free swap
       123456 non-nice user cpu ticks
         2345 nice user cpu ticks
        34567 system cpu ticks
       456789 idle cpu ticks
         5678 IO-wait cpu ticks
           89 IRQ cpu ticks
          123 softirq cpu ticks
            0 stolen cpu ticks
3. Display Disk Statistics
Show disk I/O statistics:
vmstat -dSample Output:
disk- ------------reads------------ ------------writes----------- -----IO------
       total merged sectors      ms  total merged sectors      ms    cur    sec
sda    12345    567  234567   12345   8901    234   45678    5678      0     12
sdb     4567    123   89012    2345   2345     67   12345    1234      0      5
4. Display Partition Statistics
Show partition-specific statistics:
vmstat -p /dev/sda1Sample Output:
sda1          reads   read sectors  writes    requested writes
                8945      167234       3456         67890
Practical vmstat Use Cases
1. Monitoring System Performance During Load
Monitor system performance every second during heavy operations:
vmstat 1 60This command runs for 60 seconds, updating every second, perfect for monitoring system behavior during:
- Application deployment
- Database operations
- File transfers
- System backups
2. Identifying Memory Issues
Look for these warning signs in vmstat output:
# High swap usage indicates memory pressure
vmstat 5 12

# Sample problematic output:
procs -----------memory---------- ---swap-- -----io---- -system-- ------cpu-----
 r  b   swpd   free   buff  cache   si   so    bi    bo   in   cs us sy id wa st
 5  2  524288  45678  12345  67890  156  234   123   456  789 1234 45 25 15 15  0
Warning indicators:
- High swpd value: System is using swap memory extensively
- Non-zero si/so values: Active swapping is occurring
- High ‘b’ processes: Processes waiting for I/O
- High ‘wa’ percentage: CPU waiting for I/O operations
3. CPU Performance Analysis
vmstat 3 20CPU analysis guidelines:
- High ‘us’ (user): Applications consuming CPU
- High ‘sy’ (system): Kernel processes using CPU
- High ‘wa’ (wait): I/O bottleneck
- Low ‘id’ (idle): CPU fully utilized
Combining vmstat with Other Commands
1. Save vmstat Output to File
vmstat 5 > system_performance.log &2. Monitor Specific Time Period
# Monitor for exactly 5 minutes
timeout 300 vmstat 2
3. Real-time Monitoring with Timestamps
vmstat 5 | while read line; do echo "$(date): $line"; donevmstat vs Other Monitoring Tools
| Tool | Primary Focus | Best Use Case |
|---|---|---|
| vmstat | Virtual memory, CPU, I/O | Overall system performance |
| iostat | I/O statistics | Disk performance analysis |
| top/htop | Process monitoring | Individual process analysis |
| free | Memory usage | Quick memory check |
| sar | Historical data | Long-term trend analysis |
Troubleshooting Common Issues
1. High Memory Usage
If vmstat shows low free memory:
# Check detailed memory breakdown
vmstat -s | grep -E "(memory|cache|buffer)"
Solutions:
- Clear page cache:
echo 1 > /proc/sys/vm/drop_caches - Identify memory-hungry processes:
ps aux --sort=-%mem | head - Add swap space if needed
2. I/O Bottlenecks
High ‘wa’ values indicate I/O issues:
# Monitor I/O with more detail
vmstat -d 5 10
Solutions:
- Check disk usage:
df -h - Identify I/O intensive processes:
iotop - Consider SSD upgrade or RAID configuration
Best Practices for Using vmstat
1. Regular Monitoring
- Run vmstat during peak hours to establish baselines
- Use appropriate intervals (2-5 seconds for active monitoring)
- Save logs for historical analysis
2. Automation and Scripting
#!/bin/bash
# Simple vmstat monitoring script
DATE=$(date +%Y%m%d_%H%M%S)
LOG_FILE="/var/log/vmstat_$DATE.log"

echo "Starting vmstat monitoring at $(date)" >> $LOG_FILE
vmstat 60 1440 >> $LOG_FILE &  # Monitor for 24 hours
echo "Vmstat monitoring started with PID: $!"
3. Alert Thresholds
Set up monitoring alerts based on:
- CPU usage > 90% for extended periods
- Memory usage > 85%
- Active swapping (si/so > 0)
- I/O wait > 20%
Conclusion
The vmstat command is an indispensable tool for Linux system administration and performance monitoring. It provides comprehensive insights into system behavior, helping identify bottlenecks and optimize performance. Whether you’re troubleshooting performance issues, monitoring system health, or planning capacity upgrades, mastering vmstat will significantly enhance your ability to maintain and optimize Linux systems.
Remember to combine vmstat with other monitoring tools for complete system visibility, and always establish baselines during normal operations to effectively identify anomalies. Regular monitoring with vmstat can help prevent system issues before they impact users and applications.
Start incorporating vmstat into your daily system administration routine, and you’ll quickly develop an intuitive understanding of your system’s performance characteristics and resource utilization patterns.

