
The uptime command is one of the most fundamental system monitoring tools in Linux, providing essential information about how long your system has been running and its current performance load. Whether you’re a system administrator managing servers or a developer troubleshooting performance issues, understanding the uptime command is crucial for effective system monitoring.
What is the uptime Command?
The uptime command displays critical system information in a single line, including:
- Current system time
- How long the system has been running (uptime)
- Number of currently logged-in users
- System load averages for the last 1, 5, and 15 minutes
This information helps administrators quickly assess system health and identify potential performance bottlenecks.
Basic uptime Command Syntax
The basic syntax for the uptime command is straightforward:
uptime [OPTIONS]Simple uptime Example
Running the command without any options:
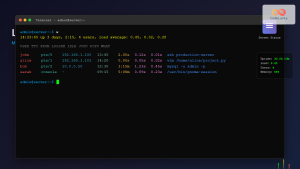
$ uptimeSample Output:
14:23:45 up 7 days, 14:32, 3 users, load average: 0.15, 0.22, 0.18This output tells us:
- 14:23:45 – Current system time
- up 7 days, 14:32 – System has been running for 7 days and 14 hours 32 minutes
- 3 users – Three users are currently logged in
- load average: 0.15, 0.22, 0.18 – Load averages for 1, 5, and 15 minutes respectively
uptime Command Options
The uptime command supports several useful options to customize its output:
-p, –pretty Option
The -p option displays uptime in a human-readable format:
$ uptime -pSample Output:
up 1 week, 3 hours, 42 minutes-s, –since Option
The -s option shows the date and time when the system was started:
$ uptime -sSample Output:
2025-08-17 23:51:23-h, –help Option
Display help information:
$ uptime -h-V, –version Option
Show version information:
$ uptime -VUnderstanding Load Average
Load average is one of the most important metrics provided by the uptime command. It represents the average system load over different time periods.
What Load Average Means
Load average indicates:
- The average number of processes that are either running or waiting for resources
- System utilization over time periods of 1, 5, and 15 minutes
- How busy your system’s CPU and I/O subsystems are
Interpreting Load Average Values
For a single-core system:
- 0.00 – System is completely idle
- 1.00 – System is fully utilized but not overloaded
- Above 1.00 – System is overloaded
For multi-core systems, multiply by the number of cores. For example, on a 4-core system:
- 4.00 – Fully utilized
- Above 4.00 – Overloaded
Example Load Average Analysis
$ uptime
15:30:22 up 2 days, 8:45, 2 users, load average: 2.15, 1.85, 1.20
This shows:
- 2.15 – High load in the last minute (recent spike)
- 1.85 – Moderate load over 5 minutes
- 1.20 – Lower load over 15 minutes (trend improving)
Practical Examples and Use Cases
Monitoring Server Health
System administrators often use uptime in scripts for monitoring:
#!/bin/bash
echo "System Status Report - $(date)"
echo "=========================="
uptime
echo ""
echo "Boot Time: $(uptime -s)"
echo "Uptime: $(uptime -p)"
Checking System After Maintenance
After system updates or maintenance:
$ uptime -s && uptime -p
2025-08-25 02:15:33
up 23 hours, 32 minutes
Load Monitoring in Scripts
Extract just the load average for automated monitoring:
$ uptime | awk '{print $10 $11 $12}'
0.15,0.22,0.18
Alternative Ways to Get Uptime Information
Using /proc/uptime
Direct access to uptime data:
$ cat /proc/uptime
654321.45 612345.67
The first number is total uptime in seconds, the second is idle time.
Using /proc/loadavg
Direct access to load average data:
$ cat /proc/loadavg
0.15 0.22 0.18 2/156 12345
Using who Command
The who command with the -b option shows boot time:
$ who -b
         system boot  2025-08-17 23:51
Troubleshooting with uptime
High Load Average Issues
When you see consistently high load averages:
$ uptime
16:45:12 up 5 days, 12:30, 4 users, load average: 8.50, 7.80, 6.20
This indicates system overload. Follow up with:
toporhtopto identify resource-hungry processesiostatto check disk I/O performancefree -hto check memory usage
System Restart Detection
Unexpectedly low uptime might indicate recent crashes or restarts:
$ uptime -p
up 15 minutes
uptime in System Monitoring Scripts
Simple Monitoring Script
#!/bin/bash
# Simple uptime monitoring script

LOAD_LIMIT=2.0
CURRENT_LOAD=$(uptime | awk '{print $10}' | sed 's/,//')

if (( $(echo "$CURRENT_LOAD > $LOAD_LIMIT" | bc -l) )); then
    echo "WARNING: High system load detected: $CURRENT_LOAD"
    echo "Full uptime output:"
    uptime
else
    echo "System load normal: $CURRENT_LOAD"
fi
Uptime Logging
Log uptime information regularly:
#!/bin/bash
# Log uptime every hour
echo "$(date): $(uptime)" >> /var/log/uptime.log
Best Practices
Regular Monitoring
- Check uptime regularly on production servers
- Set up automated alerts for high load averages
- Monitor uptime trends over time
- Include uptime checks in health monitoring scripts
Performance Baselines
- Establish normal load average ranges for your systems
- Document typical uptime patterns
- Note load variations during peak usage periods
Common Issues and Solutions
Permission Issues
The uptime command typically doesn’t require special permissions, but if you encounter issues:
$ ls -la /usr/bin/uptime
-rwxr-xr-x 1 root root 18856 Mar 15 2024 /usr/bin/uptime
Command Not Found
If uptime is not available, install the procps package:
# On Debian/Ubuntu
sudo apt-get install procps

# On Red Hat/CentOS/Fedora
sudo yum install procps-ng
Integration with Other Commands
Combining with watch
Monitor uptime continuously:
$ watch -n 5 uptimeUsing with grep for Parsing
Extract specific information:
$ uptime | grep -o 'load average.*' | cut -d' ' -f3-5
0.15, 0.22, 0.18
Conclusion
The uptime command is an essential tool for Linux system monitoring, providing quick insights into system health and performance. By understanding how to interpret uptime output, especially load averages, you can quickly identify system issues and take appropriate action. Regular use of the uptime command, combined with other monitoring tools, helps maintain optimal system performance and reliability.
Whether you’re troubleshooting performance issues, monitoring server health, or simply checking how long your system has been running, the uptime command provides valuable information in a simple, easy-to-understand format. Master this fundamental Linux command to become more effective at system administration and troubleshooting.
Related Posts

top Command Linux: Complete Guide to Real-Time Process Monitoring
The top command is one of the most essential tools in a Linux system administrator's arsenal. It provides real-time information...
w Command Linux: Complete Guide to Monitor Active Users and System Activity
The w command is one of the most essential system monitoring tools in Linux, providing administrators and users with real-time...
timedatectl Command Linux: Complete Guide to System Time and Date Management
The timedatectl command is a powerful utility in modern Linux distributions that provides a unified interface for managing system time,...
ps Command in Linux: Complete Guide to Process Monitoring and Management
The ps command is one of the most fundamental and powerful tools in Linux for displaying information about running processes....
ntpdate Command Linux: Complete Guide to Network Time Synchronization (Deprecated Tool)
The ntpdate command was once a cornerstone tool for Linux system administrators to synchronize system time with Network Time Protocol...
watch Command Linux: Monitor and Execute Commands Repeatedly in Real-Time
The watch command is one of the most powerful utilities in Linux for executing commands repeatedly at regular intervals and...
ntpd Command Linux: Complete Guide to Network Time Protocol Daemon Management
The ntpd (Network Time Protocol daemon) is a crucial system service in Linux that maintains accurate system time by synchronizing...
timedatectl Advanced Linux: Complete Time and Date Management Guide
The timedatectl command is a powerful Linux utility that provides comprehensive control over system time and date settings. As part...
sar Command Linux: System Activity Reporter for Performance Monitoring
The sar (System Activity Reporter) command is one of the most powerful and comprehensive system monitoring tools available in Linux....
htop Command Linux: Complete Guide to Advanced Process Monitoring and Management
The htop command is an enhanced, interactive version of the traditional top command that provides real-time monitoring of system processes...
systemd-timesyncd Linux: Complete Guide to Network Time Synchronization
Time synchronization is a critical aspect of system administration that ensures your Linux servers maintain accurate time across distributed networks....
at Command Linux: Complete Guide to Schedule One-time Tasks with Examples
The at command in Linux is a powerful utility for scheduling one-time tasks to run at specific times in the...


