The traceroute command is an essential network diagnostic tool in Linux that traces the path packets take from your computer to a destination server. Unlike ping which only tests connectivity, traceroute reveals every intermediate router (hop) along the network path, making it invaluable for network troubleshooting and analysis.
What is traceroute and How Does It Work?
Traceroute works by sending packets with incrementally increasing Time-To-Live (TTL) values. When a packet’s TTL expires at a router, that router sends back an ICMP “Time Exceeded” message, revealing its IP address. This process continues until the packet reaches its final destination or the maximum hop limit is reached.
The command provides three key pieces of information for each hop:
- Hop number: The sequence number of the router in the path
- IP address/hostname: The router’s network address
- Round-trip time: Time taken for packets to reach that hop and return
Basic traceroute Syntax
traceroute [options] destinationWhere destination can be:
- Domain name (e.g., google.com)
- IP address (e.g., 8.8.8.8)
- Hostname on local network
Installing traceroute
Most Linux distributions include traceroute by default. If not installed, use these commands:
Ubuntu/Debian:
sudo apt update
sudo apt install traceroute
CentOS/RHEL/Fedora:
sudo yum install traceroute
# or for newer versions
sudo dnf install traceroute
Arch Linux:
sudo pacman -S tracerouteBasic traceroute Examples
Example 1: Tracing Route to Google
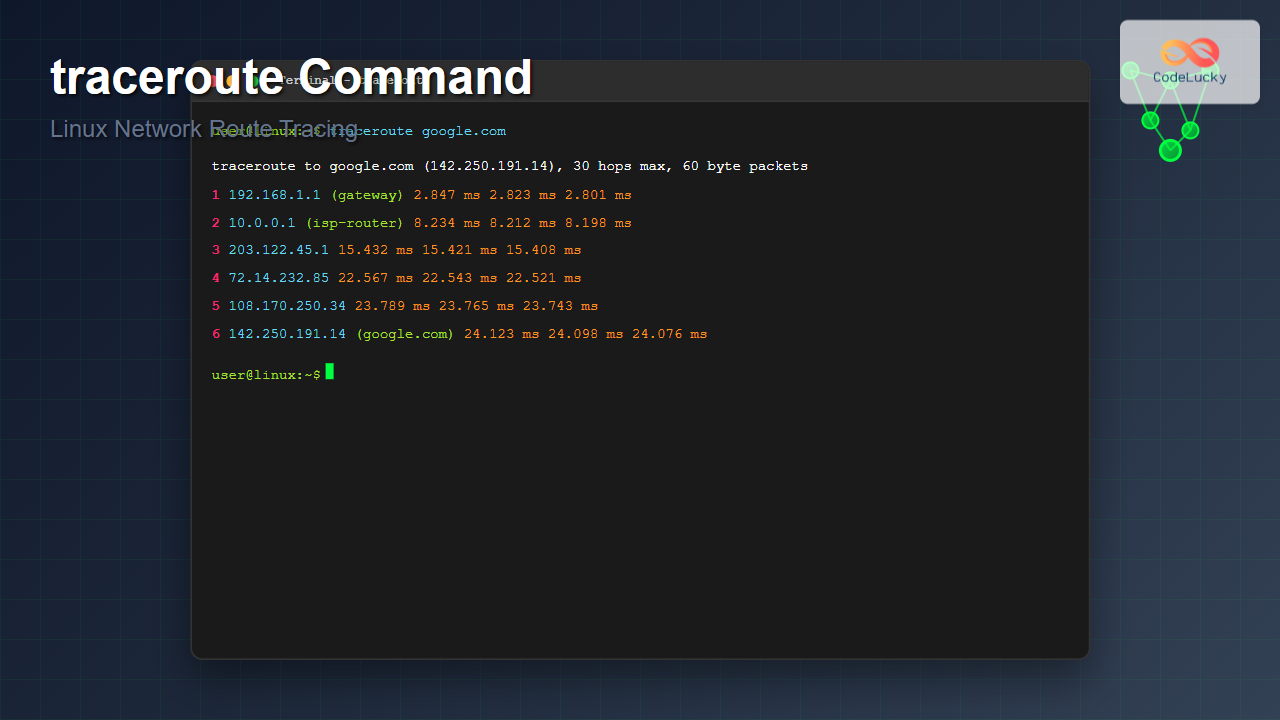
traceroute google.comSample Output:
traceroute to google.com (142.250.191.14), 30 hops max, 60 byte packets
 1  192.168.1.1 (192.168.1.1)  2.847 ms  2.823 ms  2.801 ms
 2  10.0.0.1 (10.0.0.1)  8.234 ms  8.212 ms  8.198 ms
 3  203.122.45.1 (203.122.45.1)  15.432 ms  15.421 ms  15.408 ms
 4  72.14.232.85 (72.14.232.85)  22.567 ms  22.543 ms  22.521 ms
 5  108.170.250.34 (108.170.250.34)  23.789 ms  23.765 ms  23.743 ms
 6  142.250.191.14 (142.250.191.14)  24.123 ms  24.098 ms  24.076 ms
This output shows:
- Hop 1: Local router (192.168.1.1) with ~3ms latency
- Hop 2: ISP gateway (10.0.0.1) with ~8ms latency
- Hops 3-5: Internet backbone routers
- Hop 6: Google’s server (destination reached)
Example 2: Tracing Route to a Specific IP
traceroute 8.8.8.8Sample Output:
traceroute to 8.8.8.8 (8.8.8.8), 30 hops max, 60 byte packets
 1  192.168.1.1 (192.168.1.1)  1.234 ms  1.211 ms  1.189 ms
 2  10.0.0.1 (10.0.0.1)  7.456 ms  7.432 ms  7.409 ms
 3  * * *
 4  72.14.232.85 (72.14.232.85)  18.765 ms  18.743 ms  18.721 ms
 5  8.8.8.8 (8.8.8.8)  19.876 ms  19.854 ms  19.832 ms
Note: The asterisks (*) in hop 3 indicate that the router didn’t respond, which is common due to firewall configurations.
Important traceroute Options
-n (Numeric Output)
Displays IP addresses only, skipping hostname resolution for faster execution:
traceroute -n google.comOutput:
traceroute to google.com (142.250.191.14), 30 hops max, 60 byte packets
 1  192.168.1.1  2.123 ms  2.098 ms  2.076 ms
 2  10.0.0.1  7.234 ms  7.212 ms  7.189 ms
 3  203.122.45.1  14.567 ms  14.543 ms  14.521 ms
-m (Maximum Hops)
Sets the maximum number of hops to trace:
traceroute -m 10 google.com-q (Number of Queries)
Specifies how many packets to send per hop (default is 3):
traceroute -q 1 google.comOutput:
traceroute to google.com (142.250.191.14), 30 hops max, 60 byte packets
 1  192.168.1.1 (192.168.1.1)  2.456 ms
 2  10.0.0.1 (10.0.0.1)  8.123 ms
 3  203.122.45.1 (203.122.45.1)  15.789 ms
-w (Wait Time)
Sets the timeout for each probe in seconds:
traceroute -w 2 google.com-p (Port)
Specifies the destination port for UDP packets:
traceroute -p 80 google.com-I (ICMP Echo)
Uses ICMP echo packets instead of UDP (requires root privileges):
sudo traceroute -I google.com-T (TCP SYN)
Uses TCP SYN packets for tracing (requires root privileges):
sudo traceroute -T google.comAdvanced traceroute Usage
Combining Multiple Options
traceroute -n -m 15 -q 1 -w 3 8.8.8.8This command:
- Shows only IP addresses (-n)
- Limits to 15 hops (-m 15)
- Sends only 1 packet per hop (-q 1)
- Waits maximum 3 seconds per probe (-w 3)
IPv6 traceroute
Use traceroute6 for IPv6 networks:
traceroute6 ipv6.google.comUnderstanding traceroute Output
Normal Output Interpretation
5 108.170.250.34 (108.170.250.34) 23.789 ms 23.765 ms 23.743 ms- 5: Hop number (5th router in the path)
- 108.170.250.34: IP address of the router
- (108.170.250.34): Hostname (same as IP in this case)
- 23.789 ms, 23.765 ms, 23.743 ms: Round-trip times for three packets
Special Symbols and Their Meanings
Asterisks (*)
3 * * *Indicates the router didn’t respond within the timeout period, usually due to:
- Firewall blocking ICMP messages
- Router configured not to respond to traceroute
- Network congestion
Exclamation Marks
4 192.168.1.100 5.123 ms !H 5.098 ms !H 5.076 ms !HCommon codes include:
- !H: Host unreachable
- !N: Network unreachable
- !P: Protocol unreachable
- !F: Fragmentation needed
- !X: Communication administratively prohibited
Practical Network Troubleshooting Scenarios
Scenario 1: Identifying Network Bottlenecks
Look for sudden increases in latency between hops:
traceroute -n example.com
 1  192.168.1.1      2.123 ms   2.098 ms   2.076 ms
 2  10.0.0.1         8.234 ms   8.212 ms   8.189 ms
 3  203.122.45.1    15.567 ms  15.543 ms  15.521 ms
 4  72.14.232.85   156.789 ms 156.765 ms 156.743 ms  ← Bottleneck detected
 5  108.170.250.34  158.123 ms 158.098 ms 158.076 ms
The jump from ~15ms to ~156ms at hop 4 indicates a potential bottleneck.
Scenario 2: Detecting Packet Loss
traceroute -q 10 problematic-server.comSending 10 packets per hop helps identify intermittent packet loss patterns.
Scenario 3: Comparing Different Paths
Run traceroute from different locations to compare routing paths:
# From server A
traceroute -n target-server.com

# From server B
traceroute -n target-server.com
traceroute vs Other Network Tools
| Tool | Purpose | Information Provided |
|---|---|---|
| ping | Test connectivity | Round-trip time, packet loss |
| traceroute | Trace network path | All hops, individual hop latency |
| mtr | Continuous monitoring | Real-time path and statistics |
| pathping | Windows equivalent | Combined ping and traceroute |
Common Issues and Solutions
Permission Denied Errors
Some traceroute options require root privileges:
sudo traceroute -I google.comFirewall Blocking
If getting many asterisks, try different packet types:
# Try TCP instead of UDP
sudo traceroute -T -p 80 google.com

# Try ICMP instead of UDP
sudo traceroute -I google.com
IPv6 Issues
For IPv6 networks, use the dedicated command:
traceroute6 2001:4860:4860::8888Best Practices for Using traceroute
- Use -n flag for faster execution when you don’t need hostnames
- Combine with ping for comprehensive network analysis
- Run multiple times to account for network variations
- Document results for historical comparison
- Consider time zones when analyzing international routes
Creating Scripts with traceroute
Basic Monitoring Script
#!/bin/bash
# Simple traceroute monitoring script

DESTINATION="google.com"
LOGFILE="/var/log/traceroute.log"

echo "$(date): Starting traceroute to $DESTINATION" >> $LOGFILE
traceroute -n $DESTINATION >> $LOGFILE
echo "----------------------------------------" >> $LOGFILE
Automated Network Health Check
#!/bin/bash
# Network health monitoring with traceroute

TARGETS=("8.8.8.8" "1.1.1.1" "google.com")

for target in "${TARGETS[@]}"; do
    echo "Tracing route to $target..."
    traceroute -n -m 15 -w 3 $target
    echo "========================"
done
Alternative Tools and Enhanced Options
mtr: Enhanced traceroute
For continuous monitoring, consider using mtr (My Traceroute):
mtr google.comThis provides real-time, continuously updated traceroute information with statistics.
tcptraceroute: TCP-based Tracing
For environments where UDP is blocked:
tcptraceroute google.com 80Security Considerations
When using traceroute in security-sensitive environments:
- Information disclosure: Traceroute reveals network topology
- Rate limiting: Some networks rate-limit ICMP responses
- Firewall policies: Corporate firewalls may block traceroute packets
- Privacy: Avoid running traceroute on sensitive internal networks without permission
Conclusion
The traceroute command is an indispensable tool for network administrators and troubleshooters. It provides detailed insights into network paths, helps identify bottlenecks, and assists in diagnosing connectivity issues. By understanding its various options and interpreting its output correctly, you can effectively diagnose and resolve network problems.
Remember to combine traceroute with other network diagnostic tools like ping and netstat for comprehensive network analysis. Regular use of traceroute in your network monitoring toolkit will help maintain optimal network performance and quickly identify issues when they arise.
Whether you’re troubleshooting slow connections, investigating packet loss, or mapping network topology, traceroute remains one of the most valuable commands in the Linux networking arsenal.

