
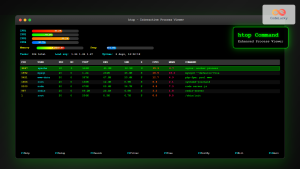
The top command is one of the most essential tools in a Linux system administrator’s arsenal. It provides real-time information about running processes, system resource usage, and overall system performance. Whether you’re troubleshooting performance issues, monitoring resource consumption, or simply keeping an eye on your system’s health, mastering the top command is crucial for effective Linux system management.
What is the top Command?
The top command displays a dynamic, real-time view of running processes and system resource utilization. Unlike static commands that show a snapshot of information, top continuously updates its display, making it invaluable for monitoring system performance over time.
Key features of the top command include:
- Real-time process monitoring
- CPU and memory usage statistics
- Interactive process management
- Customizable display options
- System load and uptime information
Basic top Command Syntax
The basic syntax for the top command is:
top [options]When executed without any options, top displays a comprehensive view of system processes and resource usage.
Understanding top Command Output
When you run the top command, you’ll see output similar to this:
top - 14:30:45 up 2 days, 3:15, 2 users, load average: 0.15, 0.20, 0.18
Tasks: 245 total, 1 running, 244 sleeping, 0 stopped, 0 zombie
%Cpu(s): 2.3 us, 1.1 sy, 0.0 ni, 96.4 id, 0.2 wa, 0.0 hi, 0.0 si, 0.0 st
MiB Mem : 8192.0 total, 2048.5 free, 3072.2 used, 3071.3 buff/cache
MiB Swap: 2048.0 total, 1536.8 free, 511.2 used. 4608.3 avail Mem

  PID USER      PR  NI    VIRT    RES    SHR S  %CPU  %MEM     TIME+ COMMAND
 1234 root      20   0  162844  12345   8765 S   5.6   0.2   0:12.34 systemd
 2345 www-data  20   0  987654  54321  32109 S   3.2   0.7   1:23.45 apache2
 3456 mysql     20   0 1234567 123456  87654 S   2.1   1.5   2:34.56 mysqld
Header Information Breakdown
First Line: System Summary
- 14:30:45 – Current time
- up 2 days, 3:15 – System uptime
- 2 users – Number of logged-in users
- load average: 0.15, 0.20, 0.18 – 1, 5, and 15-minute load averages
Second Line: Task Summary
- 245 total – Total number of processes
- 1 running – Processes currently running
- 244 sleeping – Processes in sleep state
- 0 stopped – Stopped processes
- 0 zombie – Zombie processes
Third Line: CPU Usage
- us (user) – CPU time spent on user processes
- sy (system) – CPU time spent on system processes
- ni (nice) – CPU time spent on low-priority processes
- id (idle) – CPU idle time
- wa (wait) – CPU time waiting for I/O operations
Memory Information
- total – Total physical memory
- free – Available memory
- used – Used memory
- buff/cache – Memory used for buffers and cache
Process List Columns
- PID – Process ID
- USER – Process owner
- PR – Priority
- NI – Nice value
- VIRT – Virtual memory usage
- RES – Resident memory usage
- SHR – Shared memory
- S – Process state
- %CPU – CPU usage percentage
- %MEM – Memory usage percentage
- TIME+ – Total CPU time used
- COMMAND – Command name
Common top Command Options
Display Specific Number of Processes
To limit the number of processes displayed:
top -n 10This shows only the top 10 processes by CPU usage.
Run top in Batch Mode
For scripting purposes, you can run top in batch mode:
top -b -n 1This runs top once and exits, making it suitable for capturing output in scripts.
Display Processes for Specific User
To monitor processes owned by a specific user:
top -u usernameExample:
top -u apacheSet Update Interval
To change the refresh rate (default is 3 seconds):
top -d 5This updates the display every 5 seconds.
Display Threads
To show individual threads instead of processes:
top -HInteractive Commands in top
Once top is running, you can use various interactive commands to control the display and manage processes:
Navigation and Display Commands
| Key | Function |
|---|---|
| Space | Refresh display immediately |
| q | Quit top |
| h or ? | Display help |
| k | Kill a process |
| r | Renice a process |
| u | Filter by user |
| M | Sort by memory usage |
| P | Sort by CPU usage |
| T | Sort by running time |
Sorting Options
You can sort processes by different criteria:
- P – Sort by CPU usage (default)
- M – Sort by memory usage
- N – Sort by process ID
- T – Sort by running time
Field Management
Press f to access field management where you can:
- Select which columns to display
- Change column order
- Toggle field display on/off
Practical Examples and Use Cases
Example 1: Monitoring High CPU Usage
To quickly identify processes consuming the most CPU:
top -o %CPUThis sorts processes by CPU usage in descending order, making it easy to spot resource-intensive processes.
Example 2: Monitoring Memory-Heavy Processes
To find processes using the most memory:
top -o %MEMAlternatively, once top is running, press M to sort by memory usage.
Example 3: Continuous Monitoring with Logging
To log top output to a file for later analysis:
top -b -d 30 >> system_monitor.logThis runs top in batch mode, updates every 30 seconds, and appends output to a log file.
Example 4: Monitoring Specific Process
To monitor a specific process by PID:
top -p 1234You can monitor multiple processes by separating PIDs with commas:
top -p 1234,5678,9012Advanced top Command Features
Color Coding
Modern versions of top support color coding to make information easier to read. Press z to toggle color mode on/off.
Multi-Core CPU Display
On multi-core systems, press 1 to toggle between single CPU summary and per-core CPU statistics:
%Cpu0  : 12.5 us,  2.3 sy,  0.0 ni, 85.2 id,  0.0 wa,  0.0 hi,  0.0 si,  0.0 st
%Cpu1  :  8.7 us,  1.9 sy,  0.0 ni, 89.4 id,  0.0 wa,  0.0 hi,  0.0 si,  0.0 st
%Cpu2  :  6.2 us,  1.1 sy,  0.0 ni, 92.7 id,  0.0 wa,  0.0 hi,  0.0 si,  0.0 st
%Cpu3  :  4.5 us,  0.8 sy,  0.0 ni, 94.7 id,  0.0 wa,  0.0 hi,  0.0 si,  0.0 st
Forest View
Press V to toggle forest view, which shows the process hierarchy as a tree structure, making it easier to understand parent-child relationships between processes.
Troubleshooting Common Issues
High CPU Usage Investigation
When investigating high CPU usage:
- Start top and sort by CPU usage (press
P) - Identify the top CPU consumers
- Note the process names and PIDs
- Use additional commands like
psandlsoffor deeper investigation
Memory Leak Detection
To detect potential memory leaks:
- Sort processes by memory usage (press
M) - Monitor memory usage over time
- Look for processes with steadily increasing memory consumption
- Check the VIRT and RES columns for unusual values
Alternatives to top Command
While top is excellent, consider these alternatives for specific needs:
- htop – Enhanced version with better interface and additional features
- atop – Advanced system and process monitor
- iotop – Monitors I/O usage by processes
- nload – Monitors network traffic
Best Practices for Using top
Regular Monitoring
- Run top regularly to establish baseline system behavior
- Create aliases for commonly used top configurations
- Combine top with other monitoring tools for comprehensive system analysis
Performance Optimization
- Use batch mode for automated monitoring scripts
- Adjust update intervals based on monitoring requirements
- Filter processes to focus on specific areas of interest
Security Considerations
- Be cautious when killing processes – always verify the process before termination
- Monitor for unusual processes that might indicate security issues
- Use top to verify system behavior after security updates
Conclusion
The top command is an indispensable tool for Linux system administration and monitoring. Its real-time display of process information and system resources makes it perfect for troubleshooting performance issues, monitoring system health, and managing processes effectively.
By mastering the various options, interactive commands, and advanced features of top, you’ll be better equipped to maintain optimal system performance and quickly identify and resolve issues when they arise. Whether you’re a beginner learning system administration or an experienced administrator fine-tuning server performance, the top command should be a cornerstone of your monitoring toolkit.
Remember that effective system monitoring requires understanding not just how to use the tools, but also how to interpret the data they provide. Regular practice with top in different scenarios will help you develop the expertise needed for professional system administration.
Related Posts
htop Command Linux: Complete Guide to Advanced Process Monitoring and Management
The htop command is an enhanced, interactive version of the traditional top command that provides real-time monitoring of system processes...
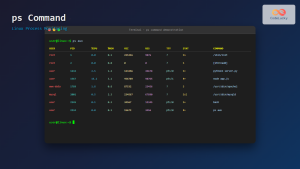
ps Command in Linux: Complete Guide to Process Monitoring and Management
The ps command is one of the most fundamental and powerful tools in Linux for displaying information about running processes....
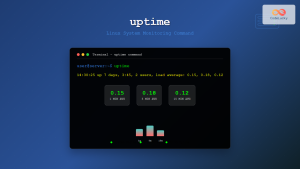
uptime Command Linux: Complete Guide to System Uptime and Load Average Monitoring
The uptime command is one of the most fundamental system monitoring tools in Linux, providing essential information about how long...
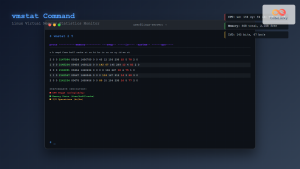
vmstat Command Linux: Monitor Virtual Memory and System Performance Statistics
The vmstat command is one of the most powerful and essential tools for Linux system administrators and developers to monitor...
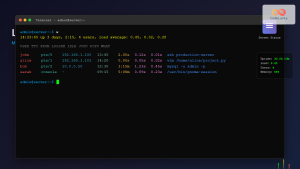
w Command Linux: Complete Guide to Monitor Active Users and System Activity
The w command is one of the most essential system monitoring tools in Linux, providing administrators and users with real-time...
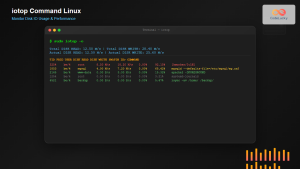
iotop Command Linux: Complete Guide to Monitor Disk IO Usage and Performance
The iotop command is an essential Linux utility that provides real-time monitoring of disk I/O usage by processes and threads....
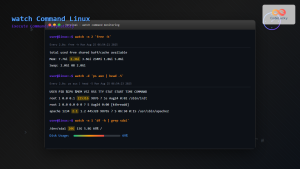
watch Command Linux: Monitor and Execute Commands Repeatedly in Real-Time
The watch command is one of the most powerful utilities in Linux for executing commands repeatedly at regular intervals and...
sar Command Linux: System Activity Reporter for Performance Monitoring
The sar (System Activity Reporter) command is one of the most powerful and comprehensive system monitoring tools available in Linux....
iftop Command Linux: Monitor Network Traffic and Display Bandwidth Usage by Connection
The iftop command is a powerful network monitoring tool in Linux that displays real-time bandwidth usage by network connections. Similar...
Nice Command Linux: Complete Guide to Process Priority Management
The nice command in Linux is a powerful system administration tool that allows you to control the priority of processes,...
perf Command Linux: Complete Performance Analysis and Profiling Guide
The perf command is one of the most powerful performance analysis tools available in Linux, offering comprehensive insights into system...

free Command in Linux: Monitor Memory Usage and Swap Space Efficiently
The free command is one of the most essential utilities in Linux for monitoring system memory usage and swap space....


