Understanding Timeline Analysis in Operating Systems
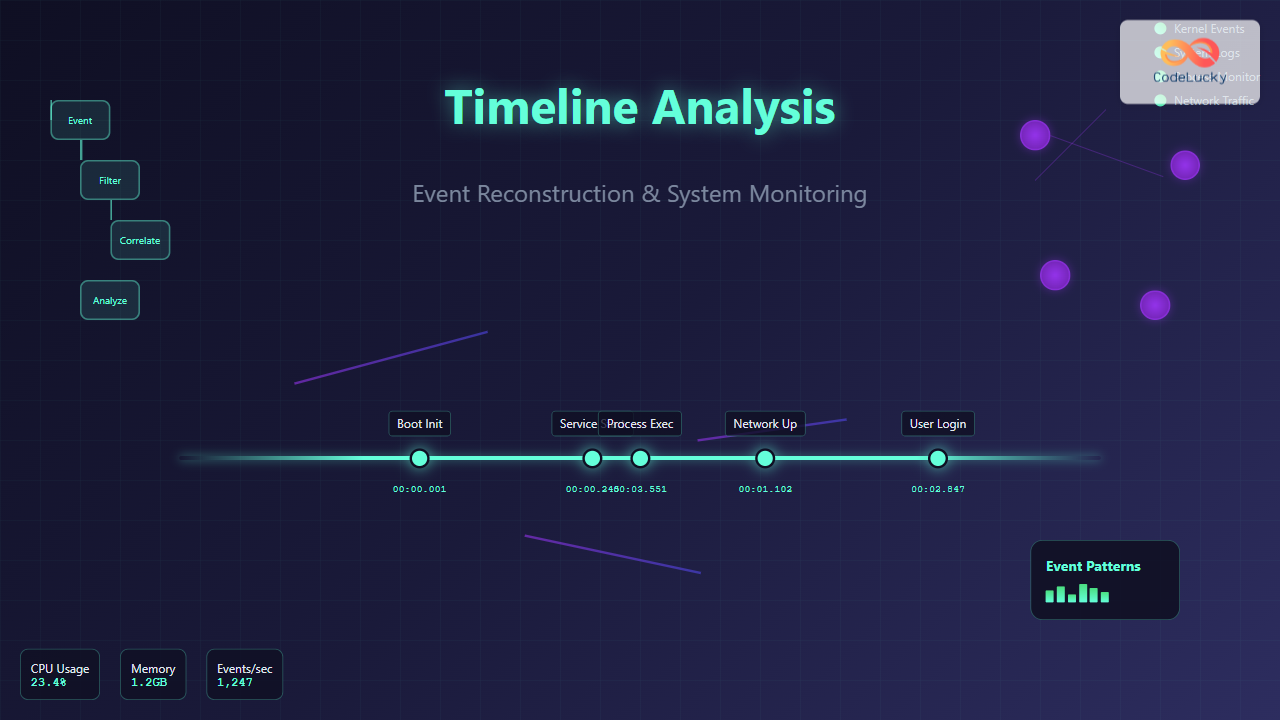
Timeline analysis is a critical technique in operating system management that involves reconstructing the sequence of events to understand system behavior, diagnose problems, or investigate security incidents. This methodology provides administrators and analysts with a chronological view of system activities, enabling them to trace the root cause of issues and understand complex system interactions.
Event reconstruction goes beyond simple log analysis by correlating data from multiple sources to create a comprehensive picture of system activity. This approach is essential for troubleshooting performance issues, security breaches, system crashes, and understanding application behavior in production environments.
Core Components of Timeline Analysis
Event Sources and Data Collection
Operating systems generate events from numerous sources, each providing different perspectives on system activity:
- System Logs: Kernel messages, service logs, authentication records
- Process Information: Process creation, termination, resource usage
- File System Events: File access, modification, deletion timestamps
- Network Activity: Connection establishment, data transfer, protocol events
- Hardware Events: Device interactions, power management, hardware errors
- Application Logs: Custom application events, database transactions
Timestamp Synchronization
Accurate timeline reconstruction requires precise timestamp synchronization across all system components. Different event sources may use various timestamp formats and time zones, making normalization crucial:
- UTC Standardization: Converting all timestamps to Coordinated Universal Time
- Clock Drift Compensation: Accounting for system clock inaccuracies
- NTP Synchronization: Ensuring network time protocol alignment
- Microsecond Precision: High-resolution timestamps for accurate sequencing
Event Reconstruction Methodologies
Forward Timeline Construction
This approach builds the timeline chronologically from the earliest event to the most recent. It’s particularly useful for understanding the progression of system states and identifying the sequence of actions leading to a specific outcome.
# Example: Forward timeline construction using system logs
tail -f /var/log/messages | while read line; do
    timestamp=$(echo "$line" | cut -d' ' -f1-3)
    event=$(echo "$line" | cut -d' ' -f4-)
    echo "[$timestamp] $event" >> timeline.log
done
Backward Timeline Analysis
Starting from a known incident or endpoint, this method traces events backwards to identify the root cause. This approach is commonly used in incident response and forensic investigations.
Correlation-Based Reconstruction
This sophisticated approach correlates events across multiple sources based on relationships rather than strict chronological order. It identifies causal relationships and dependencies between events.
Practical Implementation Examples
System Boot Analysis
Reconstructing the boot process timeline helps identify performance bottlenecks and initialization issues:
#!/usr/bin/env python3
import re
from datetime import datetime

def parse_boot_timeline(log_file):
    events = []
    with open(log_file, 'r') as f:
        for line in f:
            # Parse systemd journal format
            match = re.match(r'(\w+\s+\d+\s+\d+:\d+:\d+).*systemd\[\d+\]:\s+(.*)', line)
            if match:
                timestamp_str, event = match.groups()
                timestamp = datetime.strptime(f"2024 {timestamp_str}", "%Y %b %d %H:%M:%S")
                events.append((timestamp, event))

    # Sort by timestamp
    events.sort(key=lambda x: x[0])

    print("Boot Timeline Reconstruction:")
    print("-" * 50)
    for timestamp, event in events:
        print(f"{timestamp.strftime('%H:%M:%S.%f')[:-3]} | {event}")

# Example usage
parse_boot_timeline('/var/log/messages')
Process Execution Timeline
Tracking process lifecycle events provides insights into application behavior and resource utilization:
#!/bin/bash
# Process timeline monitoring script

monitor_process() {
    local target_process=$1
    local timeline_file="process_timeline_${target_process}.log"

    echo "Process Timeline Analysis for: $target_process" > $timeline_file
    echo "Started at: $(date)" >> $timeline_file
    echo "----------------------------------------" >> $timeline_file

    while true; do
        # Monitor process creation/termination
        ps aux | grep -v grep | grep $target_process | while read line; do
            timestamp=$(date '+%Y-%m-%d %H:%M:%S.%3N')
            echo "[$timestamp] ACTIVE: $line" >> $timeline_file
        done

        # Monitor file descriptor usage
        if pgrep $target_process > /dev/null; then
            pid=$(pgrep $target_process)
            fd_count=$(ls /proc/$pid/fd 2>/dev/null | wc -l)
            timestamp=$(date '+%Y-%m-%d %H:%M:%S.%3N')
            echo "[$timestamp] FD_COUNT: $fd_count" >> $timeline_file
        fi

        sleep 1
    done
}

monitor_process "nginx"
Advanced Timeline Analysis Techniques
Multi-Source Event Correlation
Combining data from various sources creates a comprehensive view of system activity. This technique is essential for complex troubleshooting scenarios where events span multiple system components.
Pattern Recognition and Anomaly Detection
Advanced timeline analysis incorporates pattern recognition to identify normal behavior baselines and detect anomalies:
import numpy as np
from collections import defaultdict
from datetime import datetime, timedelta

class TimelineAnalyzer:
    def __init__(self):
        self.events = []
        self.patterns = defaultdict(list)

    def add_event(self, timestamp, event_type, details):
        self.events.append({
            'timestamp': timestamp,
            'type': event_type,
            'details': details
        })

    def detect_patterns(self, window_size=60):
        """Detect recurring patterns within time windows"""
        # Group events by time windows
        time_buckets = defaultdict(list)

        for event in self.events:
            bucket = event['timestamp'] // window_size
            time_buckets[bucket].append(event)

        # Analyze patterns within each bucket
        for bucket_time, bucket_events in time_buckets.items():
            event_types = [e['type'] for e in bucket_events]
            pattern_signature = tuple(sorted(event_types))
            self.patterns[pattern_signature].append(bucket_time)

        return self.patterns

    def find_anomalies(self, threshold=2):
        """Identify unusual event sequences"""
        patterns = self.detect_patterns()
        anomalies = []

        for pattern, occurrences in patterns.items():
            if len(occurrences) < threshold:
                anomalies.append(pattern)

        return anomalies

# Example usage
analyzer = TimelineAnalyzer()
analyzer.add_event(1629360000, 'login', 'user admin')
analyzer.add_event(1629360005, 'file_access', '/etc/passwd')
analyzer.add_event(1629360010, 'network_connection', 'external_ip:443')

patterns = analyzer.detect_patterns()
anomalies = analyzer.find_anomalies()
Tools and Technologies for Timeline Analysis
Native Operating System Tools
Most operating systems provide built-in tools for event collection and basic timeline analysis:
- Linux: journalctl, ausearch, last, history
- Windows: Event Viewer, wevtutil, Get-WinEvent (PowerShell)
- macOS: log, Console.app, Activity Monitor
Advanced Analysis Frameworks
Specialized tools provide enhanced capabilities for complex timeline reconstruction:
# Example: Using journalctl for systemd timeline analysis
journalctl --since "2024-01-01 00:00:00" \
           --until "2024-01-01 23:59:59" \
           --output=json-pretty \
           | jq '.MESSAGE' \
           | sort -u > daily_timeline.txt

# Correlate with process information
ps -eo pid,ppid,cmd,etime,start --sort=start \
   | awk 'NR>1 {print $5, $0}' >> daily_timeline.txt

# Sort combined timeline
sort -k1,1 daily_timeline.txt > sorted_timeline.txt
Performance Considerations and Best Practices
Efficient Data Collection
Timeline analysis can generate massive amounts of data, requiring careful consideration of collection strategies:
- Selective Monitoring: Focus on relevant event types and sources
- Sampling Techniques: Use statistical sampling for high-volume events
- Compression Strategies: Implement data compression for storage efficiency
- Circular Buffers: Maintain rolling windows of recent events
Storage and Indexing Strategies
Efficient timeline analysis requires optimized data storage and retrieval mechanisms:
-- Example database schema for timeline events
CREATE TABLE timeline_events (
    id BIGINT PRIMARY KEY AUTO_INCREMENT,
    timestamp_unix BIGINT NOT NULL,
    timestamp_iso VARCHAR(32) NOT NULL,
    event_source VARCHAR(50) NOT NULL,
    event_type VARCHAR(50) NOT NULL,
    severity ENUM('LOW', 'MEDIUM', 'HIGH', 'CRITICAL'),
    details JSON,
    correlation_id VARCHAR(64),

    INDEX idx_timestamp (timestamp_unix),
    INDEX idx_source_type (event_source, event_type),
    INDEX idx_correlation (correlation_id),
    INDEX idx_severity (severity)
);

-- Efficient timeline query example
SELECT
    timestamp_iso,
    event_source,
    event_type,
    details
FROM timeline_events
WHERE timestamp_unix BETWEEN UNIX_TIMESTAMP('2024-01-01')
                         AND UNIX_TIMESTAMP('2024-01-02')
    AND event_source IN ('kernel', 'systemd', 'application')
ORDER BY timestamp_unix ASC;
Security Implications and Forensic Applications
Incident Response Timeline
Timeline analysis is crucial for security incident response, providing investigators with a chronological view of potential security breaches:
class SecurityTimelineAnalyzer:
    def __init__(self):
        self.security_events = []
        self.threat_indicators = {
            'failed_logins': [],
            'privilege_escalation': [],
            'unusual_network_activity': [],
            'file_system_changes': []
        }

    def analyze_security_timeline(self, start_time, end_time):
        """Analyze timeline for security indicators"""
        timeline = []

        # Filter events within time range
        for event in self.security_events:
            if start_time <= event['timestamp'] <= end_time:
                timeline.append(event)

        # Sort chronologically
        timeline.sort(key=lambda x: x['timestamp'])

        # Identify threat patterns
        self.identify_threat_patterns(timeline)

        return timeline

    def identify_threat_patterns(self, timeline):
        """Pattern matching for common attack vectors"""
        for i, event in enumerate(timeline):
            if event['type'] == 'authentication_failure':
                # Look for brute force patterns
                similar_events = [e for e in timeline[i:i+10]
                                if e['type'] == 'authentication_failure']
                if len(similar_events) > 5:
                    self.threat_indicators['failed_logins'].append({
                        'start_time': similar_events[0]['timestamp'],
                        'count': len(similar_events),
                        'pattern': 'potential_brute_force'
                    })
Chain of Custody and Evidence Preservation
For forensic applications, maintaining the integrity of timeline data is paramount. This includes cryptographic hashing, digital signatures, and tamper-evident logging systems.
Challenges and Limitations
Common Obstacles in Timeline Analysis
Timeline analysis faces several technical and practical challenges:
- Volume Management: Handling massive amounts of event data
- Clock Synchronization: Ensuring accurate timestamps across distributed systems
- Data Correlation: Linking related events from different sources
- False Positives: Distinguishing between normal and anomalous patterns
- Performance Impact: Minimizing system overhead from monitoring
Mitigation Strategies
Effective timeline analysis implementation requires addressing these challenges through proven strategies:
#!/bin/bash
# Timeline analysis optimization script

optimize_timeline_analysis() {
    # Configure log rotation to manage volume
    cat << EOF > /etc/logrotate.d/timeline-events
/var/log/timeline/*.log {
    daily
    rotate 30
    compress
    delaycompress
    missingok
    notifempty
    create 644 root root
}
EOF

    # Set up NTP synchronization for accurate timestamps
    systemctl enable ntp
    systemctl start ntp

    # Configure high-resolution timestamps
    echo 'kernel.printk_time = 1' >> /etc/sysctl.conf

    # Optimize filesystem for log performance
    mount -o noatime,nodiratime /dev/sdb1 /var/log/timeline
}

optimize_timeline_analysis
Future Trends and Emerging Technologies
Timeline analysis continues to evolve with advances in technology and changing system architectures:
- Machine Learning Integration: AI-powered pattern recognition and anomaly detection
- Real-time Stream Processing: Instantaneous event correlation and analysis
- Distributed Systems Support: Timeline reconstruction across microservices and containers
- Cloud-Native Solutions: Scalable timeline analysis for cloud environments
- Blockchain-Based Integrity: Immutable audit trails and tamper-proof timelines
Timeline analysis and event reconstruction represent fundamental capabilities for modern operating system management. By mastering these techniques, administrators and analysts can effectively troubleshoot complex issues, ensure system security, and maintain optimal performance. The key to successful implementation lies in understanding the various event sources, implementing efficient data collection and correlation strategies, and utilizing appropriate tools for analysis.
As systems become increasingly complex and distributed, the importance of comprehensive timeline analysis will only continue to grow. Organizations that invest in robust timeline analysis capabilities will be better positioned to maintain system reliability, respond to incidents effectively, and ensure the security of their computing infrastructure.
- Understanding Timeline Analysis in Operating Systems
- Core Components of Timeline Analysis
- Event Reconstruction Methodologies
- Practical Implementation Examples
- Advanced Timeline Analysis Techniques
- Tools and Technologies for Timeline Analysis
- Performance Considerations and Best Practices
- Security Implications and Forensic Applications
- Challenges and Limitations
- Future Trends and Emerging Technologies

