
Thruk is a powerful web-based monitoring interface designed primarily for Nagios and compatible monitoring systems. As a comprehensive frontend solution, it provides system administrators with an intuitive dashboard to monitor network infrastructure, server health, and service availability in real-time.
What is Thruk?
Thruk serves as a modern replacement for the traditional Nagios web interface, offering enhanced functionality, better performance, and improved user experience. Developed in Perl, it supports multiple monitoring backends including Nagios, Icinga, Shinken, and Naemon.
Key Features of Thruk
- Multi-backend support: Works with various monitoring engines
- Mobile responsive design: Accessible on all devices
- Advanced reporting: Generate detailed reports and analytics
- Custom dashboards: Create personalized monitoring views
- REST API: Programmatic access to monitoring data
- Performance optimization: Faster loading and better resource usage
Installing Thruk on Linux
Prerequisites
Before installing Thruk, ensure your system meets the following requirements:
# Check system information
uname -a
cat /etc/os-release

# Verify Perl installation
perl --version

# Check Apache/Nginx status
systemctl status apache2
# or
systemctl status nginx
Installation on Ubuntu/Debian
# Update package repository
sudo apt update

# Install required dependencies
sudo apt install -y apache2 libapache2-mod-fcgid perl-modules

# Download Thruk package
wget https://download.thruk.org/pkg/v3.06.2/ubuntu20/amd64/thruk_3.06.2_amd64.deb

# Install Thruk
sudo dpkg -i thruk_3.06.2_amd64.deb

# Fix any dependency issues
sudo apt-get install -f
Installation on CentOS/RHEL
# Install EPEL repository
sudo yum install -y epel-release

# Install required packages
sudo yum install -y httpd perl-CGI perl-JSON

# Download and install Thruk RPM
wget https://download.thruk.org/pkg/v3.06.2/rhel8/x86_64/thruk-3.06.2-1.x86_64.rpm
sudo rpm -ivh thruk-3.06.2-1.x86_64.rpm
Configuration and Setup
Basic Configuration File
The main configuration file is located at /etc/thruk/thruk_local.conf:
# Edit the configuration file
sudo nano /etc/thruk/thruk_local.conf

# Basic configuration example
<Component Thruk::Backend>
    <peer>
        name    = Local Nagios
        type    = livestatus
        options = {
            peer          = 127.0.0.1:6557
            resource_file = /etc/nagios3/resource.cfg
        }
        <configtool>
            core_type      = nagios
            core_conf      = /etc/nagios3/nagios.cfg
            obj_check_cmd  = /usr/sbin/nagios3 -v /etc/nagios3/nagios.cfg
            obj_reload_cmd = /etc/init.d/nagios3 reload
        </configtool>
    </peer>
</Component>
Web Server Configuration
Configure Apache to serve Thruk:
# Enable required Apache modules
sudo a2enmod rewrite
sudo a2enmod fcgid

# Create Thruk virtual host
sudo nano /etc/apache2/sites-available/thruk.conf
Add the following virtual host configuration:
<VirtualHost *:80>
    ServerName monitoring.example.com
    DocumentRoot /usr/share/thruk/root

    <Location /thruk>
        Options ExecCGI
        SetHandler fcgid-script
    </Location>

    ScriptAlias /thruk /usr/share/thruk/script/thruk_fastcgi.pl

    <Directory /usr/share/thruk/root>
        AllowOverride All
        Require all granted
    </Directory>
</VirtualHost>
# Enable the site and restart Apache
sudo a2ensite thruk
sudo systemctl restart apache2Authentication Setup
Basic Authentication
Configure basic HTTP authentication:
# Create htpasswd file
sudo htpasswd -c /etc/thruk/htpasswd thrukadmin

# Set proper permissions
sudo chown www-data:www-data /etc/thruk/htpasswd
sudo chmod 640 /etc/thruk/htpasswd
User Authorization Configuration
Edit the CGI configuration for user permissions:
# Edit CGI configuration
sudo nano /etc/thruk/cgi.cfg

# Configure authorized users
authorized_for_system_information=thrukadmin
authorized_for_configuration_information=thrukadmin
authorized_for_system_commands=thrukadmin
authorized_for_all_services=thrukadmin
authorized_for_all_hosts=thrukadmin
Using Thruk Interface
Accessing the Dashboard
Navigate to your Thruk installation:
# Access via web browser
http://your-server-ip/thruk
# or
https://monitoring.example.com/thruk
Main Dashboard Features
The Thruk dashboard provides several key sections:
- Status Summary: Overview of all monitored services and hosts
- Tactical Overview: Quick statistics and problem summary
- Host Groups: Organized view of monitored infrastructure
- Service Groups: Categorized service monitoring
Advanced Configuration Examples
Multi-Backend Setup
Configure multiple monitoring backends:
<Component Thruk::Backend>
    <peer>
        name    = Production Nagios
        type    = livestatus
        options = {
            peer = production-server:6557
        }
    </peer>

    <peer>
        name    = Development Icinga
        type    = livestatus
        options = {
            peer = dev-server:6558
        }
    </peer>
</Component>
Custom Dashboard Creation
Create a custom dashboard configuration:
# Create dashboard configuration
sudo nano /etc/thruk/dashboard.conf

# Dashboard example
<dashboard>
    title = Network Operations Center
    refresh = 30

    <widget>
        type = status
        title = Critical Services
        filter = state = 2 and type = service
    </widget>

    <widget>
        type = chart
        title = Service Performance
        source = rrd
        timeframe = 24h
    </widget>
</dashboard>
Troubleshooting Common Issues
Permission Problems
# Fix file permissions
sudo chown -R www-data:www-data /var/cache/thruk
sudo chown -R www-data:www-data /var/log/thruk

# Check log files for errors
sudo tail -f /var/log/thruk/thruk.log
sudo tail -f /var/log/apache2/error.log
Backend Connection Issues
Verify backend connectivity:
# Test Livestatus connection
echo "GET hosts" | nc localhost 6557

# Check Nagios status
sudo systemctl status nagios3
sudo systemctl status livestatus
Performance Optimization
Optimize Thruk performance with these settings:
# Add to thruk_local.conf
use_feature_reports = 0
use_feature_configtool = 0
cache_file = /var/cache/thruk/thruk.cache
expire = 300

# Enable FastCGI caching
<fastcgi>
    processes = 5
    max_requests = 1000
</fastcgi>
Command Line Operations
Thruk CLI Commands
Thruk provides several command-line utilities:
# Check Thruk status
sudo thruk -l

# Generate reports
sudo thruk -a report -f pdf --output=/tmp/report.pdf

# Cache management
sudo thruk -a cache clear
sudo thruk -a cache preload

# User management
sudo thruk -a user list
sudo thruk -a user add --username=newuser --password=secret
Backup and Maintenance
# Backup Thruk configuration
sudo tar -czf thruk-backup-$(date +%Y%m%d).tar.gz /etc/thruk

# Update Thruk installation
sudo apt update && sudo apt upgrade thruk

# Check configuration syntax
sudo thruk -a config check
Integration with Monitoring Tools
Nagios Integration
Configure Thruk with Nagios Core:
# Enable Livestatus module in Nagios
echo "broker_module=/usr/lib/check_mk/livestatus.o /var/lib/nagios3/rw/live" | sudo tee -a /etc/nagios3/nagios.cfg

# Restart Nagios
sudo systemctl restart nagios3
Custom Plugin Integration
Add custom monitoring plugins:
# Create custom plugin directory
sudo mkdir -p /usr/local/lib/nagios/plugins

# Example custom plugin script
cat <<EOF | sudo tee /usr/local/lib/nagios/plugins/check_custom.sh
#!/bin/bash
# Custom monitoring plugin
if [ -f /tmp/service.lock ]; then
    echo "CRITICAL - Service locked"
    exit 2
else
    echo "OK - Service running normally"
    exit 0
fi
EOF

sudo chmod +x /usr/local/lib/nagios/plugins/check_custom.sh
Security Best Practices
SSL/HTTPS Configuration
Enable HTTPS for secure access:
# Generate SSL certificate
sudo openssl req -x509 -nodes -days 365 -newkey rsa:2048 \
  -keyout /etc/ssl/private/thruk.key \
  -out /etc/ssl/certs/thruk.crt

# Configure SSL virtual host
sudo nano /etc/apache2/sites-available/thruk-ssl.conf
Access Control Configuration
# Restrict access by IP
<Directory /usr/share/thruk/root>
    Require ip 192.168.1.0/24
    Require ip 10.0.0.0/8
</Directory>

# Enable additional security headers
Header always set X-Frame-Options DENY
Header always set X-Content-Type-Options nosniff
Monitoring Best Practices
Implement these best practices for effective monitoring with Thruk:
- Regular Updates: Keep Thruk and dependencies updated
- Log Monitoring: Monitor Thruk access and error logs
- Performance Tuning: Optimize cache settings and backend connections
- User Training: Ensure team members understand the interface
- Documentation: Maintain configuration documentation
Thruk provides a robust and flexible monitoring interface that enhances network infrastructure visibility. With proper configuration and maintenance, it serves as an excellent tool for system administrators managing complex monitoring environments. The interface’s modern design, multi-backend support, and extensive customization options make it a valuable addition to any monitoring infrastructure.
Related Posts
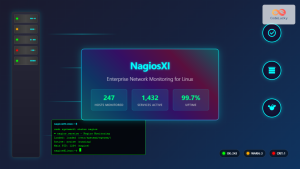
nagiosxi Linux: Complete Enterprise Network Monitoring Guide with Commands and Configuration
NagiosXI represents the pinnacle of enterprise network monitoring solutions on Linux systems, offering comprehensive infrastructure oversight with advanced alerting, reporting,...
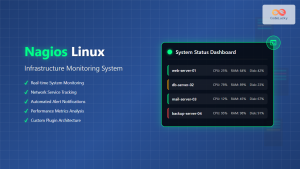
nagios Linux: Complete Infrastructure Monitoring System Setup Guide
Introduction to Nagios Nagios is one of the most popular open-source infrastructure monitoring systems available for Linux environments. Originally developed...

centreon Linux: Complete IT Infrastructure Monitoring Solution Guide
Centreon is a powerful, open-source IT infrastructure monitoring platform built on top of Nagios Core. It provides a comprehensive web-based...

op5 Linux: Complete Network Monitoring Solution Guide
op5 Linux is a comprehensive network monitoring solution built on top of the proven Nagios monitoring engine. This enterprise-grade platform...
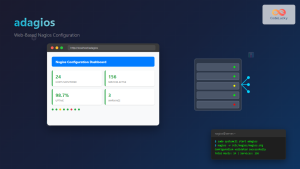
adagios Linux: Complete Guide to Web-Based Nagios Configuration Management
Managing Nagios configurations can be complex and time-consuming, especially when dealing with multiple hosts and services. adagios revolutionizes this process...

icinga Linux: Complete Network Monitoring System Guide for System Administrators
Icinga is a powerful open-source network monitoring system that helps system administrators monitor network resources, notify users of outages, and...
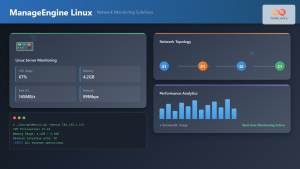
ManageEngine Linux: Complete Network Monitoring Solutions Guide
Network monitoring is crucial for maintaining optimal performance and security in Linux environments. ManageEngine provides powerful network monitoring solutions specifically...

PandoraFMS Linux: Complete Network Monitoring Platform Guide
PandoraFMS is a comprehensive, open-source network monitoring platform that provides complete visibility into your IT infrastructure. This powerful monitoring solution...

LibreNMS Linux: Complete Network Monitoring System Setup and Configuration Guide
LibreNMS is a powerful, open-source network monitoring platform that provides comprehensive visibility into network infrastructure. Built on PHP and MySQL,...
Groundwork Linux: Complete Guide to IT Infrastructure Monitoring and System Health Management
What is Groundwork Linux? Groundwork Linux is a comprehensive open-source IT infrastructure monitoring platform built specifically for Linux environments. It...

Spiceworks Linux: Complete Network Monitoring and Management Guide
Spiceworks is a powerful, free IT network monitoring and management platform that has revolutionized how system administrators handle their infrastructure....
check_mk Linux: Complete Guide to Nagios-Based System Monitoring
check_mk is a powerful monitoring system built on top of Nagios that simplifies infrastructure monitoring with automated service discovery and...


