
The tcpdump command is one of the most powerful network analysis tools available in Linux systems. It allows system administrators and network engineers to capture, filter, and analyze network packets in real-time, making it indispensable for network troubleshooting, security monitoring, and performance analysis.
What is tcpdump?
tcpdump is a command-line packet analyzer that runs on Unix-like operating systems. It allows users to display TCP/IP and other packets being transmitted or received over a network interface. The tool captures packets directly from the network interface and can save them to files for later analysis or display them in real-time.
Key Features of tcpdump
- Real-time packet capture – Monitor network traffic as it happens
- Advanced filtering – Capture only specific types of traffic
- Multiple output formats – Save packets in various formats
- Protocol analysis – Decode multiple network protocols
- Cross-platform compatibility – Works on most Unix-like systems
Installation and Prerequisites
Most Linux distributions come with tcpdump pre-installed. If not, you can install it using your package manager:
# Ubuntu/Debian
sudo apt-get install tcpdump

# CentOS/RHEL/Fedora
sudo yum install tcpdump
# or
sudo dnf install tcpdump

# Arch Linux
sudo pacman -S tcpdump
Important: tcpdump requires root privileges to capture packets on network interfaces.
Basic tcpdump Syntax
The basic syntax of tcpdump follows this pattern:
tcpdump [options] [expression]Common Options
| Option | Description |
|---|---|
-i interface |
Specify network interface to monitor |
-c count |
Capture specified number of packets |
-w file |
Write packets to file |
-r file |
Read packets from file |
-v, -vv, -vvv |
Increase verbosity level |
-n |
Don’t resolve hostnames |
-s snaplen |
Set packet capture length |
Basic tcpdump Examples
1. List Available Network Interfaces
Before capturing packets, identify available network interfaces:
sudo tcpdump -DExample Output:
1.eth0 [Up, Running]
2.lo [Up, Running, Loopback]
3.wlan0 [Up, Running, Wireless]
4.any (Pseudo-device that captures on all interfaces)
5.bluetooth-monitor [Wireless]
2. Capture All Traffic on Default Interface
sudo tcpdumpExample Output:
tcpdump: verbose output suppressed, use -v or -vv for full protocol decode
listening on eth0, link-type EN10MB (Ethernet), capture size 262144 bytes
14:30:25.123456 IP 192.168.1.100.ssh > 192.168.1.50.45678: Flags [P.], seq 1:49, ack 1, win 64240, length 48
14:30:25.123789 IP 192.168.1.50.45678 > 192.168.1.100.ssh: Flags [.], ack 49, win 65535, length 0
14:30:25.124012 IP 192.168.1.100.domain > 8.8.8.8.domain: 12345+ A? example.com. (29)
3. Capture Packets on Specific Interface
sudo tcpdump -i eth04. Capture Limited Number of Packets
sudo tcpdump -c 10This captures exactly 10 packets and then stops.
Advanced Filtering with tcpdump
tcpdump’s real power lies in its filtering capabilities. You can create complex filters to capture only the traffic you’re interested in.
Protocol Filters
Capture Only TCP Traffic
sudo tcpdump tcpCapture Only UDP Traffic
sudo tcpdump udpCapture Only ICMP Traffic
sudo tcpdump icmpHost-based Filters
Capture Traffic to/from Specific Host
sudo tcpdump host 192.168.1.100Capture Traffic from Specific Source
sudo tcpdump src host 192.168.1.100Capture Traffic to Specific Destination
sudo tcpdump dst host 192.168.1.100Port-based Filters
Capture Traffic on Specific Port
sudo tcpdump port 80Capture Traffic on Port Range
sudo tcpdump portrange 80-443Capture SSH Traffic
sudo tcpdump port 22Example Output:
14:35:10.456789 IP 192.168.1.50.45678 > 192.168.1.100.ssh: Flags [P.], seq 1:25, ack 1, win 65535, length 24
14:35:10.456890 IP 192.168.1.100.ssh > 192.168.1.50.45678: Flags [P.], seq 1:89, ack 25, win 64216, length 88
Complex Filtering Examples
1. HTTP Traffic Analysis
Capture HTTP traffic with verbose output:
sudo tcpdump -i eth0 -vvv -s 1024 -A 'tcp port 80'The -A flag displays packet content in ASCII, making HTTP headers readable.
2. DNS Query Monitoring
sudo tcpdump -i eth0 -vv 'udp port 53'Example Output:
14:40:15.789012 IP (tos 0x0, ttl 64, id 12345, offset 0, flags [DF], proto UDP (17), length 57)
    192.168.1.100.54321 > 8.8.8.8.domain: [udp sum ok] 54321+ A? example.com. (29)
14:40:15.789234 IP (tos 0x0, ttl 58, id 0, offset 0, flags [none], proto UDP (17), length 73)
    8.8.8.8.domain > 192.168.1.100.54321: [udp sum ok] 54321 1/0/0 example.com. A 93.184.216.34 (45)
3. Monitor Specific Network Conversations
sudo tcpdump -i eth0 'host 192.168.1.100 and host 192.168.1.200'4. Exclude Specific Traffic
sudo tcpdump -i eth0 'not port 22'This captures all traffic except SSH connections.
Saving and Reading Packet Captures
Save Packets to File
sudo tcpdump -i eth0 -w capture.pcapSave with Rotation
Create multiple files with size or time-based rotation:
# Rotate every 100MB, keep 5 files
sudo tcpdump -i eth0 -w capture.pcap -C 100 -W 5

# Rotate every hour
sudo tcpdump -i eth0 -w capture_%Y%m%d_%H%M%S.pcap -G 3600
Read from Saved File
tcpdump -r capture.pcapFilter Saved Capture
tcpdump -r capture.pcap 'tcp port 80'Advanced tcpdump Features
Timestamp Options
Human-readable Timestamps
sudo tcpdump -i eth0 -tttAbsolute Timestamps
sudo tcpdump -i eth0 -ttttPacket Content Display
Hexadecimal and ASCII Output
sudo tcpdump -i eth0 -X 'icmp'Example Output:
14:45:20.123456 IP 192.168.1.100 > 8.8.8.8: ICMP echo request, id 12345, seq 1, length 64
        0x0000:  4500 0054 1234 4000 4001 abcd c0a8 0164  E..T.4@[email protected]
        0x0010:  0808 0808 0800 f7fc 3039 0001 6162 6364  ........09..abcd
        0x0020:  6566 6768 696a 6b6c 6d6e 6f70 7172 7374  efghijklmnopqrst
        0x0030:  7576 7761 6263 6465 6667 6869            uvwabcdefghi
Network Layer Analysis
Monitor ARP Traffic
sudo tcpdump -i eth0 arpIPv6 Traffic
sudo tcpdump -i eth0 ip6Practical Use Cases
1. Troubleshooting Network Connectivity
Check if packets are reaching a destination:
sudo tcpdump -i eth0 'host 192.168.1.200 and icmp'Then ping the host from another terminal:
ping 192.168.1.2002. Monitoring Web Server Traffic
Analyze HTTP requests to your web server:
sudo tcpdump -i eth0 -A -s 0 'tcp port 80 and (((ip[2:2] - ((ip[0]&0xf)<<2)) - ((tcp[12]&0xf0)>>2)) != 0)'This complex filter captures only HTTP packets with payload data.
3. Security Monitoring
Detect potential port scanning:
sudo tcpdump -i eth0 'tcp[tcpflags] & (tcp-syn|tcp-fin) != 0 and not src and dst net 192.168.1.0/24'4. Database Connection Monitoring
Monitor MySQL connections:
sudo tcpdump -i eth0 -s 0 -A 'dst port 3306'Performance Optimization Tips
1. Use Appropriate Snap Length
Set capture length based on your needs:
# Capture only headers (faster)
sudo tcpdump -i eth0 -s 96

# Capture full packets
sudo tcpdump -i eth0 -s 0
2. Efficient Filtering
Place most restrictive filters first:
# Good: Protocol filter first
sudo tcpdump -i eth0 'tcp and host 192.168.1.100 and port 80'

# Less efficient: Host filter first
sudo tcpdump -i eth0 'host 192.168.1.100 and tcp and port 80'
3. Use Buffer Size Options
sudo tcpdump -i eth0 -B 4096 'tcp port 80'Integration with Other Tools
Pipe to grep for Text Analysis
sudo tcpdump -i eth0 -A 'tcp port 80' | grep "User-Agent"Combine with awk for Statistics
sudo tcpdump -i eth0 -c 100 | awk '{print $3}' | sort | uniq -c | sort -nrExport to Wireshark
Capture packets and analyze in Wireshark:
sudo tcpdump -i eth0 -w network_analysis.pcapThen open the file in Wireshark for detailed GUI analysis.
Common tcpdump Pitfalls and Solutions
1. Permission Issues
Problem: “Operation not permitted” error
Solution: Always run tcpdump with sudo or as root
2. High CPU Usage
Problem: tcpdump consuming too much CPU
Solution: Use more specific filters and appropriate snap lengths
3. Missing Packets
Problem: Packets being dropped
Solution: Increase buffer size with -B option
4. Large Capture Files
Problem: Capture files growing too large
Solution: Use file rotation with -C and -W options
Security Considerations
Sensitive Data Exposure
Be cautious when capturing packets as they may contain sensitive information:
- Passwords in cleartext protocols
- Session cookies
- Personal data
- API keys and tokens
Best Practices
- Limit capture duration and scope
- Secure captured files with appropriate permissions
- Delete captures after analysis
- Use encrypted protocols when possible
- Follow organizational data handling policies
Conclusion
The tcpdump command is an essential tool for network administrators, security professionals, and developers working with network applications. Its powerful filtering capabilities, combined with the ability to capture and analyze packets in real-time, make it invaluable for troubleshooting network issues, monitoring security, and understanding network behavior.
Mastering tcpdump requires practice and understanding of network protocols, but the investment pays off in faster problem resolution and deeper network insights. Start with basic captures and gradually work your way up to complex filtering expressions as you become more comfortable with the tool.
Remember to always use tcpdump responsibly, respecting privacy and security considerations, and following your organization’s policies regarding network monitoring and data capture.
Related Posts
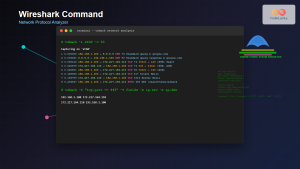
Wireshark Command Linux: Complete Network Protocol Analyzer Guide
Wireshark is the world's most popular network protocol analyzer, providing deep visibility into network traffic and communication protocols. While most...

iptraf Command Linux: Complete Interactive Network Monitoring Guide
The iptraf command is a powerful console-based network monitoring utility for Linux systems that provides real-time IP LAN monitoring capabilities....
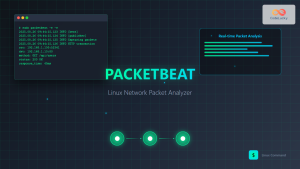
packetbeat Linux: Complete Network Packet Analysis Tool Guide
Network packet analysis is crucial for system administrators, security professionals, and developers who need to monitor, troubleshoot, and secure network...
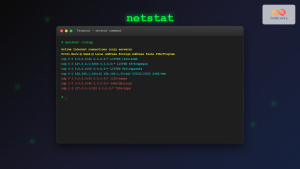
netstat Command Linux: Complete Guide to Network Connection Monitoring
The netstat command is one of the most essential network monitoring tools in Linux systems. It provides comprehensive information about...
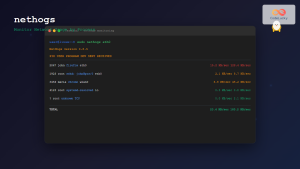
nethogs Command Linux: Monitor Real-Time Network Usage by Process
Network monitoring is a crucial aspect of system administration, especially when you need to identify which processes are consuming bandwidth...

iptables Command Linux: Complete Guide to Configure Firewall Rules
The iptables command is one of the most powerful and essential tools for managing firewall rules in Linux systems. As...
nmap Command Linux: Complete Guide to Network Mapping and Port Scanning
The nmap (Network Mapper) command is one of the most powerful and versatile network discovery and security auditing tools available...
nload Command Linux: Complete Guide to Monitor Network Traffic and Bandwidth in Real-Time
The nload command is a powerful Linux utility that provides real-time monitoring of network traffic and bandwidth usage. Unlike basic...
jnettop Command Linux: Monitor Real-Time Network Traffic by Connection
The jnettop command is a powerful Linux network monitoring tool that provides real-time visibility into network traffic organized by individual...
ntopng Command Linux: Complete Guide to Web-Based Network Traffic Monitoring
Network traffic monitoring is crucial for maintaining optimal network performance, security, and troubleshooting connectivity issues. The ntopng command provides a...
bmon Command Linux: Complete Guide to Real-Time Bandwidth Monitoring and Network Analysis
The bmon (Bandwidth Monitor) command is a powerful Linux utility designed for real-time network bandwidth monitoring and rate estimation. This...
iftop Command Linux: Monitor Network Traffic and Display Bandwidth Usage by Connection
The iftop command is a powerful network monitoring tool in Linux that displays real-time bandwidth usage by network connections. Similar...


