
The tail command is one of the most essential tools in Linux for displaying the last lines of files and monitoring log files in real-time. Whether you’re troubleshooting system issues, monitoring application logs, or simply viewing the end of large files, mastering the tail command is crucial for effective Linux system administration.
What is the tail Command?
The tail command displays the last part (tail) of files. By default, it shows the last 10 lines of a file, but this behavior can be customized using various options. The command is particularly useful for monitoring log files that continuously grow as new entries are added.
Basic Syntax
tail [OPTION]... [FILE]...If no file is specified, tail reads from standard input. Multiple files can be processed simultaneously.
Essential tail Command Options
Display Specific Number of Lines (-n)
The -n option allows you to specify how many lines to display from the end of the file:
# Show last 5 lines
tail -n 5 /var/log/syslog

# Alternative syntax
tail -5 /var/log/syslog
Example Output:
Aug 24 23:45:12 server systemd[1]: Started Session 142 of user root.
Aug 24 23:45:15 server kernel: [12345.678901] usb 1-1: USB disconnect
Aug 24 23:45:18 server NetworkManager[1234]: device (eth0): link connected
Aug 24 23:45:20 server sshd[5678]: Accepted publickey for user from 192.168.1.100
Aug 24 23:45:22 server systemd[1]: Reached target Multi-User System.
Follow Files in Real-Time (-f)
The -f (follow) option is perhaps the most powerful feature of tail, allowing you to monitor files as they grow:
# Follow a log file in real-time
tail -f /var/log/apache2/access.log

# Follow with specific number of lines
tail -n 20 -f /var/log/syslog
When using -f, tail continues running and displays new lines as they are appended to the file. Press Ctrl+C to stop following.
Display Bytes Instead of Lines (-c)
Use the -c option to display a specific number of bytes from the end of the file:
# Show last 100 bytes
tail -c 100 filename.txt

# Show last 1KB
tail -c 1024 largefile.log
Verbose Output (-v)
The -v option displays headers when processing files:
tail -v /var/log/auth.logExample Output:
==> /var/log/auth.log <==
Aug 24 23:40:01 server sudo: user : TTY=pts/0 ; PWD=/home/user ; USER=root ; COMMAND=/bin/ls
Aug 24 23:41:15 server sshd[1234]: Connection closed by 192.168.1.100 port 22
Aug 24 23:42:30 server login[5678]: pam_unix(login:session): session opened for user
Advanced tail Command Features
Follow Multiple Files
Monitor several files simultaneously with headers showing which file each line comes from:
tail -f /var/log/syslog /var/log/auth.log /var/log/apache2/error.logExample Output:
==> /var/log/syslog <==
Aug 24 23:45:01 server cron[1234]: (root) CMD (command executed)

==> /var/log/auth.log <==
Aug 24 23:45:05 server sudo: user : command executed successfully

==> /var/log/apache2/error.log <==
[Sun Aug 24 23:45:10 2025] [notice] Apache/2.4.41 configured
Follow by Name vs File Descriptor (-F)
The -F option is useful for log rotation scenarios:
# Follow by name, retry if file is inaccessible
tail -F /var/log/application.log
This option automatically detects when a file is rotated or recreated and continues following the new file.
Quiet Output (-q)
Suppress headers when processing multiple files:
tail -q /var/log/syslog /var/log/auth.logPractical Examples and Use Cases
Monitoring Web Server Logs
Monitor Apache access logs in real-time to see incoming requests:
tail -f /var/log/apache2/access.logExample Output:
192.168.1.100 - - [24/Aug/2025:23:45:01 +0530] "GET /index.html HTTP/1.1" 200 1234
192.168.1.101 - - [24/Aug/2025:23:45:02 +0530] "POST /api/login HTTP/1.1" 200 567
192.168.1.102 - - [24/Aug/2025:23:45:03 +0530] "GET /images/logo.png HTTP/1.1" 304 -
System Log Analysis
Check recent system messages and errors:
# View recent system messages
tail -n 50 /var/log/syslog

# Monitor for errors in real-time
tail -f /var/log/syslog | grep -i error
Application Log Monitoring
Monitor application-specific logs with custom line counts:
# Monitor database logs
tail -n 100 -f /var/log/mysql/error.log

# Follow PHP error logs
tail -f /var/log/php/error.log
Combining tail with Other Commands
Using tail with grep
Filter specific patterns while following logs:
# Monitor only SSH login attempts
tail -f /var/log/auth.log | grep ssh

# Watch for specific error patterns
tail -f /var/log/apache2/error.log | grep -i "404\|500\|error"
Using tail with awk
Extract specific fields from log entries:
# Extract IP addresses from access logs
tail -f /var/log/apache2/access.log | awk '{print $1}'

# Show only timestamps and HTTP status codes
tail -f /var/log/apache2/access.log | awk '{print $4, $5, $9}'
Using tail with sed
Transform log output on-the-fly:
# Highlight error messages
tail -f /var/log/syslog | sed 's/ERROR/\x1b[31mERROR\x1b[0m/g'
tail vs head Command
While tail shows the end of files, head shows the beginning. They complement each other perfectly:
# Show first 10 lines
head /var/log/syslog

# Show last 10 lines
tail /var/log/syslog

# Show lines 11-20 (combining both)
head -n 20 /var/log/syslog | tail -n 10
Performance Considerations
Large File Handling
For extremely large files, tail is highly efficient because it reads from the end:
# Efficiently read last lines from a 10GB file
tail -n 1000 huge_logfile.log

# Monitor large files without loading entire content
tail -f massive_application.log
Memory Usage
Unlike commands that load entire files into memory, tail uses minimal resources:
# Memory-efficient monitoring of growing files
tail -f /var/log/high-volume.log
Common Use Cases in System Administration
Troubleshooting Services
Quickly diagnose service issues by monitoring relevant logs:
# Monitor systemd service logs
tail -f /var/log/syslog | grep servicename

# Check recent service starts/stops
tail -n 50 /var/log/syslog | grep "systemd"
Security Monitoring
Keep track of authentication attempts and security events:
# Monitor SSH login attempts
tail -f /var/log/auth.log | grep "sshd"

# Watch for failed login attempts
tail -f /var/log/auth.log | grep "Failed password"
Performance Monitoring
Track application performance through log analysis:
# Monitor slow queries in MySQL
tail -f /var/log/mysql/slow.log

# Track response times in web server logs
tail -f /var/log/nginx/access.log | awk '{print $(NF-1)}'
Tips and Best Practices
Keyboard Shortcuts
Ctrl+C: Stop following a fileCtrl+Z: Suspend the tail process (usefgto resume)q: Quit when using less pagination
Combining with Screen or tmux
For long-term monitoring, use screen or tmux sessions:
# Start a screen session for log monitoring
screen -S logwatch
tail -f /var/log/syslog

# Detach with Ctrl+A, D
# Reattach later with: screen -r logwatch
Log Rotation Handling
Use -F option for files that undergo log rotation:
# Handles log rotation automatically
tail -F /var/log/application.log
Error Handling and Troubleshooting
Common Errors
Permission Denied:
# Use sudo for protected log files
sudo tail -f /var/log/secure
File Not Found:
# Check if file exists
ls -la /var/log/filename
# Or use find to locate log files
find /var/log -name "*application*" -type f
Monitoring Non-Existent Files
Use -F option to wait for files that don’t exist yet:
# Wait for file creation and then follow
tail -F /path/to/future/logfile.log
Advanced Scripting with tail
Log Alert Script
#!/bin/bash
# Simple log monitoring script
tail -f /var/log/syslog | while read line; do
    if echo "$line" | grep -q "ERROR"; then
        echo "Alert: $line" | mail -s "System Error" [email protected]
    fi
done
Multi-File Monitoring
#!/bin/bash
# Monitor multiple log files simultaneously
tail -f /var/log/syslog /var/log/auth.log /var/log/apache2/error.log | \
while read line; do
    echo "$(date): $line"
done
Conclusion
The tail command is an indispensable tool for Linux system administrators and developers. Its ability to efficiently display the last lines of files and monitor them in real-time makes it perfect for log analysis, troubleshooting, and system monitoring. Whether you’re tracking web server access logs, monitoring application errors, or following system messages, mastering tail command options and combinations with other utilities will significantly enhance your Linux command-line productivity.
From basic file viewing to advanced real-time monitoring scenarios, the tail command provides the flexibility and power needed for effective log management. Remember to combine it with other command-line tools like grep, awk, and sed to create powerful log analysis pipelines that can help you quickly identify and resolve system issues.
Related Posts
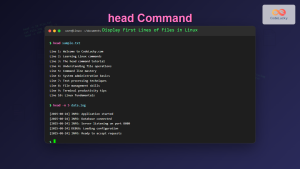
head Command in Linux: Display First Lines of Files Efficiently
The head command is one of the most fundamental and frequently used utilities in Linux and Unix-like operating systems. It...
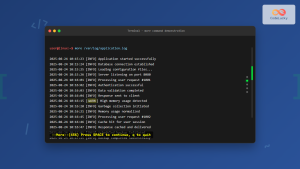
more Command Linux: Complete Guide to Paginated File Viewing
The more command is one of the most essential Linux utilities for viewing file contents in a controlled, paginated manner....
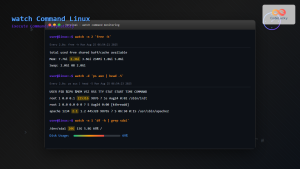
watch Command Linux: Monitor and Execute Commands Repeatedly in Real-Time
The watch command is one of the most powerful utilities in Linux for executing commands repeatedly at regular intervals and...
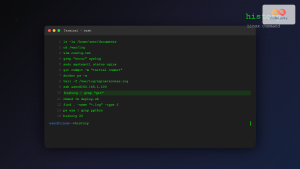
history Command Linux: Complete Guide to View and Manage Your Command History
The history command in Linux is one of the most powerful tools for managing and navigating your command line experience....
cat Command in Linux: Complete Guide to Display and Concatenate Files
The cat command is one of the most fundamental and frequently used commands in Linux and Unix-like operating systems. Short...
redirect Command Linux: Complete Input Output Redirection Guide
Linux redirection is a powerful feature that allows you to control where command input comes from and where output goes....
rsyslog Command Linux: System Logging Configuration with Examples
rsyslog is one of the most powerful and widely used system logging tools in Linux. It stands for “rocket-fast syslog”...
logger Command Linux: Complete Guide to System Log Message Management
The logger command in Linux is a powerful utility that allows users and scripts to send messages directly to the...
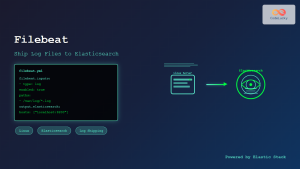
filebeat Linux: Complete Guide to Ship Log Files to Elasticsearch with Real Examples
Filebeat is a lightweight log shipper that belongs to the Elastic Stack (formerly ELK Stack) ecosystem. It's designed to monitor...
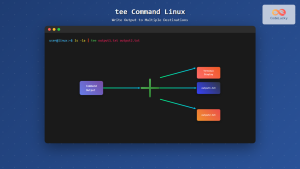
tee Command Linux: Write Output to Multiple Destinations Simultaneously
The tee command in Linux is a powerful utility that reads from standard input and writes the output to both...

less Command Linux: Complete Guide to View Large Files Page by Page
The less command is one of the most essential tools for Linux system administrators and developers who need to view...
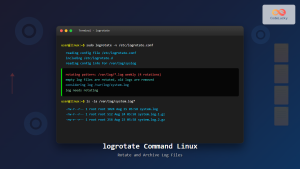
logrotate Command Linux: Complete Guide to Rotate and Archive Log Files
Log files are essential for monitoring system health, debugging applications, and maintaining security. However, without proper management, these files can...


