System performance optimization is a critical skill for system administrators, developers, and IT professionals. When systems run slowly, applications lag, or resources are underutilized, effective tuning can dramatically improve performance and user experience. This comprehensive guide covers essential performance optimization techniques across different system components.
Understanding System Performance Fundamentals
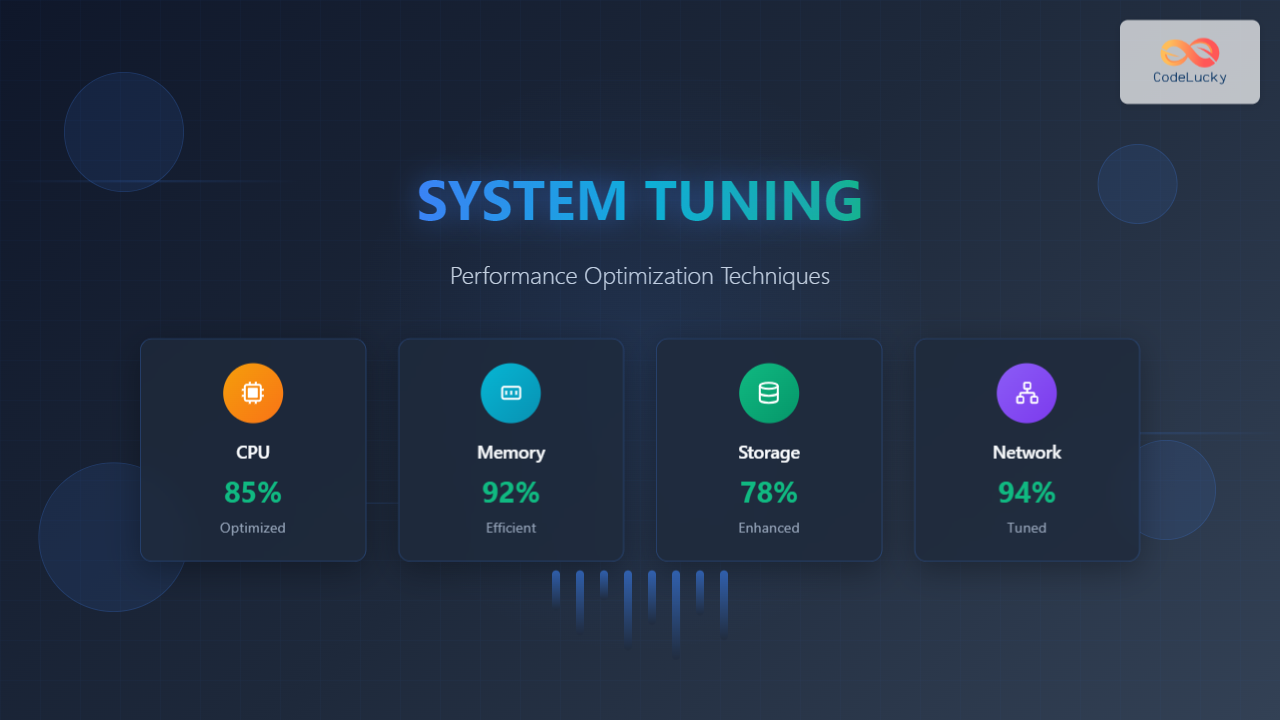
Before diving into optimization techniques, it’s crucial to understand what affects system performance. Modern computer systems have four primary bottlenecks that can limit performance:
- CPU (Central Processing Unit): Processing power and computational capacity
- Memory (RAM): Data storage and retrieval speed
- Storage (I/O): Disk read/write operations
- Network: Data transmission and connectivity
Performance Monitoring and Analysis
Effective tuning begins with comprehensive monitoring. You need to identify bottlenecks before applying optimizations. Here are essential monitoring tools and techniques:
Linux Monitoring Commands
# Monitor real-time system performance
top
htop

# Check CPU usage by process
ps aux --sort=-%cpu | head -10

# Monitor memory usage
free -h
cat /proc/meminfo

# Check disk I/O statistics
iostat -x 1
iotop

# Network monitoring
netstat -i
iftop
Windows Performance Monitoring
# Task Manager equivalent in command line
tasklist /fo table

# Performance counters
typeperf "\Processor(_Total)\% Processor Time" -si 1

# Memory information
systeminfo | findstr "Total Physical Memory"

# Disk performance
wmic logicaldisk get size,freespace,caption
CPU Performance Optimization
CPU optimization focuses on maximizing processing efficiency and reducing computational overhead. Here are key strategies:
Process Priority and Scheduling
Adjusting process priorities can significantly impact system responsiveness. Critical applications should receive higher priority while background tasks should have lower priority.
# Linux: Set process priority (nice values: -20 to 19)
nice -n -10 important_application
renice -10 -p 1234  # Renice existing process

# Check current priorities
ps -eo pid,ppid,ni,comm
# Windows: Set process priority
wmic process where name="application.exe" call setpriority "high priority"

# PowerShell alternative
Get-Process application | Set-Process -Priority High
CPU Affinity Configuration
CPU affinity binds processes to specific CPU cores, reducing context switching and improving cache efficiency:
# Linux: Set CPU affinity
taskset -c 0,1 application_command  # Bind to cores 0 and 1
taskset -p 0x3 1234  # Set affinity for existing process

# Check current affinity
taskset -p 1234
CPU Frequency Scaling
Modern CPUs support dynamic frequency scaling. Configure governors for optimal performance:
# Check available governors
cat /sys/devices/system/cpu/cpu0/cpufreq/scaling_available_governors

# Set performance governor
echo performance | sudo tee /sys/devices/system/cpu/cpu*/cpufreq/scaling_governor

# Set on-demand governor for power saving
echo ondemand | sudo tee /sys/devices/system/cpu/cpu*/cpufreq/scaling_governor
Memory Optimization Techniques
Memory optimization involves managing RAM efficiently, configuring swap space, and optimizing cache usage.
Memory Usage Analysis
# Detailed memory breakdown
cat /proc/meminfo
vmstat 1 5  # Display virtual memory statistics

# Memory usage by process
ps aux --sort=-%mem | head -10
pmap -d PID  # Memory map for specific process
Swap Configuration
Proper swap configuration prevents out-of-memory conditions while maintaining performance:
# Check current swap usage
swapon -s
free -h

# Adjust swappiness (0-100, default 60)
echo 10 | sudo tee /proc/sys/vm/swappiness
# Make permanent in /etc/sysctl.conf
echo 'vm.swappiness=10' | sudo tee -a /etc/sysctl.conf

# Create additional swap file if needed
sudo fallocate -l 2G /swapfile
sudo chmod 600 /swapfile
sudo mkswap /swapfile
sudo swapon /swapfile
Buffer and Cache Optimization
# Clear page cache (use carefully in production)
sync && echo 1 | sudo tee /proc/sys/vm/drop_caches

# Adjust dirty ratio for better I/O performance
echo 15 | sudo tee /proc/sys/vm/dirty_ratio
echo 5 | sudo tee /proc/sys/vm/dirty_background_ratio

# Configure in /etc/sysctl.conf for persistence
vm.dirty_ratio=15
vm.dirty_background_ratio=5
Huge Pages Configuration
Huge pages can significantly improve performance for memory-intensive applications:
# Check huge page status
cat /proc/meminfo | grep Huge

# Configure huge pages
echo 1024 | sudo tee /proc/sys/vm/nr_hugepages

# Make permanent
echo 'vm.nr_hugepages=1024' | sudo tee -a /etc/sysctl.conf

# Mount hugepages filesystem
sudo mkdir /mnt/hugepages
sudo mount -t hugetlbfs nodev /mnt/hugepages
Storage and I/O Optimization
Storage optimization focuses on improving disk performance through file system tuning, I/O scheduling, and disk configuration.
File System Optimization
# Ext4 optimization options
sudo mount -o remount,noatime,commit=60 /dev/sda1 /

# Check file system performance
sudo tune2fs -l /dev/sda1 | grep -i "mount count"

# Optimize ext4 parameters
sudo tune2fs -o journal_data_writeback /dev/sda1
sudo tune2fs -O ^has_journal /dev/sda1  # Remove journal for read-only systems
I/O Scheduler Tuning
Different I/O schedulers work better for different workloads:
# Check current I/O scheduler
cat /sys/block/sda/queue/scheduler

# Set deadline scheduler (good for databases)
echo deadline | sudo tee /sys/block/sda/queue/scheduler

# Set noop scheduler (good for SSDs)
echo noop | sudo tee /sys/block/sda/queue/scheduler

# Configure permanently in /etc/default/grub
GRUB_CMDLINE_LINUX="elevator=deadline"
SSD Optimization
# Enable TRIM for SSD
sudo fstrim -v /

# Configure automatic TRIM
sudo systemctl enable fstrim.timer

# Check SSD alignment
sudo parted /dev/sda align-check optimal 1

# Optimize SSD mount options
/dev/sda1 / ext4 defaults,noatime,discard 0 1
Network Performance Tuning
Network optimization involves tuning TCP/IP parameters, buffer sizes, and connection handling for optimal throughput and latency.
TCP/IP Stack Optimization
# Increase network buffer sizes
echo 'net.core.rmem_default = 262144' | sudo tee -a /etc/sysctl.conf
echo 'net.core.rmem_max = 16777216' | sudo tee -a /etc/sysctl.conf
echo 'net.core.wmem_default = 262144' | sudo tee -a /etc/sysctl.conf
echo 'net.core.wmem_max = 16777216' | sudo tee -a /etc/sysctl.conf

# TCP window scaling
echo 'net.ipv4.tcp_window_scaling = 1' | sudo tee -a /etc/sysctl.conf

# TCP congestion control
echo 'net.ipv4.tcp_congestion_control = bbr' | sudo tee -a /etc/sysctl.conf

# Apply changes
sudo sysctl -p
High-Performance Network Settings
# Increase connection tracking table size
echo 'net.netfilter.nf_conntrack_max = 1048576' | sudo tee -a /etc/sysctl.conf

# Optimize TCP TIME_WAIT
echo 'net.ipv4.tcp_tw_reuse = 1' | sudo tee -a /etc/sysctl.conf
echo 'net.ipv4.tcp_fin_timeout = 30' | sudo tee -a /etc/sysctl.conf

# Increase local port range
echo 'net.ipv4.ip_local_port_range = 1024 65535' | sudo tee -a /etc/sysctl.conf
Application-Specific Tuning
Database Optimization
Database systems require specific tuning approaches:
-- MySQL optimization example
SET GLOBAL innodb_buffer_pool_size = 2147483648; -- 2GB
SET GLOBAL innodb_log_file_size = 268435456;     -- 256MB
SET GLOBAL innodb_flush_log_at_trx_commit = 2;
SET GLOBAL query_cache_size = 67108864;          -- 64MB
Web Server Tuning
# Apache optimization
ServerLimit 16
MaxRequestWorkers 400
ThreadsPerChild 25
ThreadLimit 64

# Enable compression
LoadModule deflate_module modules/mod_deflate.so
SetOutputFilter DEFLATE
# Nginx optimization
worker_processes auto;
worker_connections 4096;
sendfile on;
tcp_nopush on;
tcp_nodelay on;
keepalive_timeout 65;

# Enable gzip compression
gzip on;
gzip_comp_level 6;
gzip_types text/plain text/css application/json;
Advanced Optimization Techniques
NUMA (Non-Uniform Memory Access) Optimization
For multi-socket systems, NUMA awareness can significantly improve performance:
# Check NUMA topology
numactl --hardware
lscpu | grep NUMA

# Bind process to specific NUMA node
numactl --cpunodebind=0 --membind=0 application

# Check NUMA statistics
numastat
cat /proc/numastat
Container and Virtualization Tuning
# Docker resource limits
docker run --cpus="2.0" --memory="4g" --memory-swap="4g" application

# Set CPU affinity for container
docker run --cpuset-cpus="0,1" application

# Kubernetes resource limits
resources:
  limits:
    cpu: 2
    memory: 4Gi
  requests:
    cpu: 1
    memory: 2Gi
Performance Testing and Validation
After implementing optimizations, thorough testing validates improvements:
Stress Testing Tools
# CPU stress testing
stress --cpu 4 --timeout 60s

# Memory stress testing
stress --vm 2 --vm-bytes 1024M --timeout 60s

# I/O stress testing
fio --name=randwrite --ioengine=libaio --iodepth=1 --rw=randwrite --bs=4k --size=1G --numjobs=4 --runtime=60 --group_reporting

# Network bandwidth testing
iperf3 -s  # Server
iperf3 -c server_ip -t 60  # Client
Benchmarking and Monitoring
# System benchmark
sysbench cpu run
sysbench memory run
sysbench fileio --file-test-mode=rndrw prepare
sysbench fileio --file-test-mode=rndrw run

# Database benchmark
sysbench oltp_read_write --mysql-host=localhost --mysql-user=user --mysql-password=pass --tables=10 --table-size=100000 prepare
sysbench oltp_read_write --mysql-host=localhost --mysql-user=user --mysql-password=pass --tables=10 --table-size=100000 run
Monitoring and Maintenance
Continuous monitoring ensures optimizations remain effective over time:
Automated Performance Monitoring
# Set up performance monitoring script
#!/bin/bash
# performance_monitor.sh

LOG_FILE="/var/log/performance.log"
DATE=$(date)

echo "=== Performance Report - $DATE ===" >> $LOG_FILE

# CPU usage
echo "CPU Usage:" >> $LOG_FILE
top -bn1 | grep "Cpu(s)" >> $LOG_FILE

# Memory usage
echo "Memory Usage:" >> $LOG_FILE
free -h >> $LOG_FILE

# Disk I/O
echo "Disk I/O:" >> $LOG_FILE
iostat -x 1 1 >> $LOG_FILE

# Network statistics
echo "Network Statistics:" >> $LOG_FILE
cat /proc/net/dev >> $LOG_FILE

echo "================================" >> $LOG_FILE
Performance Alerting
# Simple alerting script
#!/bin/bash
# performance_alert.sh

CPU_THRESHOLD=80
MEM_THRESHOLD=85
DISK_THRESHOLD=90

CPU_USAGE=$(top -bn1 | grep "Cpu(s)" | awk '{print $2}' | cut -d'%' -f1)
MEM_USAGE=$(free | grep Mem | awk '{printf "%.0f", $3/$2 * 100.0}')
DISK_USAGE=$(df / | tail -1 | awk '{print $5}' | cut -d'%' -f1)

if [ "$CPU_USAGE" -gt "$CPU_THRESHOLD" ]; then
    echo "High CPU usage: ${CPU_USAGE}%" | mail -s "Performance Alert" [email protected]
fi

if [ "$MEM_USAGE" -gt "$MEM_THRESHOLD" ]; then
    echo "High memory usage: ${MEM_USAGE}%" | mail -s "Performance Alert" [email protected]
fi

if [ "$DISK_USAGE" -gt "$DISK_THRESHOLD" ]; then
    echo "High disk usage: ${DISK_USAGE}%" | mail -s "Performance Alert" [email protected]
fi
Best Practices and Common Pitfalls
Optimization Best Practices
- Measure before optimizing: Always establish baseline metrics before making changes
- One change at a time: Implement optimizations incrementally to identify effective changes
- Document everything: Keep detailed records of all changes and their impacts
- Test thoroughly: Validate optimizations under realistic workloads
- Monitor continuously: Performance can degrade over time due to various factors
Common Pitfalls to Avoid
- Over-optimization: Excessive tuning can lead to system instability
- Ignoring bottlenecks: Optimizing the wrong component won’t improve overall performance
- Hardware limitations: Software tuning can’t overcome fundamental hardware constraints
- Security trade-offs: Some optimizations may compromise system security
- Version compatibility: Ensure optimizations are compatible with your software versions
Conclusion
System tuning and performance optimization is an ongoing process that requires careful analysis, methodical implementation, and continuous monitoring. The techniques covered in this guide provide a comprehensive foundation for optimizing system performance across CPU, memory, storage, and network components.
Remember that effective optimization is highly dependent on your specific workload, hardware configuration, and performance requirements. Start with monitoring and analysis to identify actual bottlenecks, then apply targeted optimizations while carefully measuring their impact.
Regular performance reviews and proactive monitoring ensure that your optimizations continue to provide value as your system evolves. With these techniques and best practices, you can achieve significant performance improvements and maintain optimal system efficiency.

