
The strace command is one of the most powerful debugging and monitoring tools available in Linux systems. It allows you to trace system calls and signals made by a process, providing invaluable insights into how programs interact with the operating system kernel. Whether you’re debugging a misbehaving application, analyzing performance bottlenecks, or learning how programs work internally, strace is an essential tool in every Linux administrator’s toolkit.
What is strace?
strace stands for “system call trace” and is a diagnostic, debugging, and instructional userspace utility for Linux. It monitors and tampers with interactions between processes and the Linux kernel, which include system calls, signal deliveries, and changes of process state.
System calls are the interface between user-space applications and the kernel. When a program needs to perform operations like reading files, allocating memory, or creating network connections, it makes system calls to request these services from the kernel.
Installing strace
Most Linux distributions include strace by default. If it’s not installed, you can install it using your distribution’s package manager:
Ubuntu/Debian:
sudo apt update
sudo apt install strace
CentOS/RHEL/Fedora:
sudo yum install strace
# or for newer versions
sudo dnf install strace
Arch Linux:
sudo pacman -S straceBasic strace Syntax
The basic syntax of strace is straightforward:
strace [options] command [arguments]
strace [options] -p PID
You can either run strace with a new command or attach it to an existing process using its Process ID (PID).
Basic Usage Examples
Tracing a Simple Command
Let’s start with a basic example by tracing the ls command:
strace lsThis produces extensive output showing every system call made by the ls command. Here’s a snippet of what you might see:
execve("/usr/bin/ls", ["ls"], 0x7ffd8c9c1580 /* 67 vars */) = 0
brk(NULL)                               = 0x55c8e9b4f000
arch_prctl(ARCH_SET_FS, 0x7f8b9c8a5580) = 0
set_tid_address(0x7f8b9c8a5850)        = 2845
set_robust_list(0x7f8b9c8a5860, 24)    = 0
rseq(0x7f8b9c8a5ea0, 0x20, 0, 0x53053053) = 0
mprotect(0x7f8b9c8b2000, 16384, PROT_READ) = 0
mprotect(0x55c8e8f6b000, 4096, PROT_READ) = 0
openat(AT_FDCWD, ".", O_RDONLY|O_NONBLOCK|O_CLOEXEC|O_DIRECTORY) = 3
getdents64(3, /* 5 entries */, 32768)  = 136
write(1, "file1.txt  file2.txt  folder1\n", 30) = 30
close(3)                                = 0
exit_group(0)                           = ?
Filtering Output with -e Option
The complete output can be overwhelming. Use the -e option to filter specific system calls:
strace -e trace=openat,read,write lsopenat(AT_FDCWD, "/etc/ld.so.cache", O_RDONLY|O_CLOEXEC) = 3
openat(AT_FDCWD, "/lib/x86_64-linux-gnu/libselinux.so.1", O_RDONLY|O_CLOEXEC) = 3
read(3, "\177ELF\2\1\1\0\0\0\0\0\0\0\0\0", 832) = 832
openat(AT_FDCWD, "/lib/x86_64-linux-gnu/libc.so.6", O_RDONLY|O_CLOEXEC) = 3
read(3, "\177ELF\2\1\1\3\0\0\0\0\0\0\0\0", 832) = 832
openat(AT_FDCWD, ".", O_RDONLY|O_NONBLOCK|O_CLOEXEC|O_DIRECTORY) = 3
write(1, "file1.txt file2.txt folder1\n", 30file1.txt file2.txt folder1
) = 30Advanced strace Options
Attaching to Running Processes
You can attach strace to an already running process using the -p option:
strace -p 1234To find the PID of a process, use commands like ps, pidof, or pgrep:
pidof firefox
strace -p $(pidof firefox)
Following Child Processes
Use the -f option to follow child processes created by fork(), vfork(), and clone():
strace -f -e trace=execve bash -c "ls | grep txt"execve("/usr/bin/bash", ["bash", "-c", "ls | grep txt"], 0x7fff5c7b1580 /* 67 vars */) = 0
strace: Process 2847 attached
[pid 2847] execve("/usr/bin/ls", ["ls"], 0x55c8e9b4f000 /* 67 vars */) = 0
strace: Process 2848 attached
[pid 2848] execve("/usr/bin/grep", ["grep", "txt"], 0x55c8e9b4f000 /* 67 vars */) = 0Timing Information
Add timing information to understand performance characteristics:
strace -t lsFor more detailed timing, use -tt for microseconds or -ttt for seconds since epoch:
strace -tt -e trace=write echo "Hello World"14:22:15.123456 write(1, "Hello World\n", 12Hello World
) = 12Counting System Calls
Use the -c option to get a summary count of system calls:
strace -c ls% time seconds usecs/call calls errors syscall
------ ----------- ----------- --------- --------- ----------------
25.00 0.000020 10 2 write
20.00 0.000016 8 2 mprotect
15.00 0.000012 6 2 openat
10.00 0.000008 8 1 munmap
10.00 0.000008 8 1 read
5.00 0.000004 4 1 close
5.00 0.000004 4 1 fstat
------ ----------- ----------- --------- --------- ----------------
100.00 0.000072 10 totalPractical Debugging Examples
Debugging File Access Issues
When a program fails to open a file, strace can show exactly what’s happening:
strace -e trace=openat,access cat /nonexistent/file.txtopenat(AT_FDCWD, "/nonexistent/file.txt", O_RDONLY) = -1 ENOENT (No such file or directory)
cat: /nonexistent/file.txt: No such file or directoryNetwork Debugging
Trace network-related system calls:
strace -e trace=network curl -s https://httpbin.org/ipsocket(AF_INET6, SOCK_STREAM, IPPROTO_TCP) = 3
connect(3, {sa_family=AF_INET6, sin6_port=htons(443), inet_pton(AF_INET6, "2a04:4e42:400::734", &sin6_addr), sin6_flowinfo=htonl(0), sin6_scope_id=0}, 28) = 0
sendto(3, "GET /ip HTTP/1.1\r\nHost: httpbin.org\r\n...", 78, MSG_NOSIGNAL, NULL, 0) = 78Memory Allocation Debugging
Monitor memory-related system calls:
strace -e trace=mmap,munmap,brk python3 -c "print('Hello')"Using strace for Performance Analysis
Identifying Slow System Calls
Use the -T option to show the time spent in each system call:
strace -T -e trace=read,write dd if=/dev/zero of=/tmp/test bs=1M count=100read(0, "\0\0\0\0\0\0\0\0\0\0\0\0\0\0\0\0\0\0\0\0\0\0\0\0\0\0\0\0\0\0\0\0"..., 1048576) = 1048576 <0.000123>
write(1, "\0\0\0\0\0\0\0\0\0\0\0\0\0\0\0\0\0\0\0\0\0\0\0\0\0\0\0\0\0\0\0\0"..., 1048576) = 1048576 <0.003421>Statistical Analysis
Combine counting with timing for comprehensive analysis:
strace -c -T find /usr -name "*.conf" 2>/dev/nullOutput Redirection and Filtering
Saving Output to File
Redirect strace output to a file for analysis:
strace -o trace_output.txt lsYou can also append to a file:
strace -o trace_output.txt -A lsFiltering by System Call Categories
Filter by categories of system calls:
# File operations
strace -e trace=file ls

# Process operations
strace -e trace=process bash -c "echo test"

# Network operations
strace -e trace=network wget -q -O /dev/null https://example.com
Advanced Filtering Techniques
Excluding System Calls
Use the exclamation mark to exclude specific system calls:
strace -e trace=!read,write lsConditional Tracing
Trace only successful or failed system calls:
# Only successful calls
strace -e trace=openat -z ls

# Only failed calls
strace -e trace=openat -Z ls
Interactive Debugging Session
Let’s walk through a complete debugging session. Suppose you have a script that’s behaving unexpectedly:
#!/bin/bash
# problematic_script.sh
echo "Starting script..."
cat /etc/passwd | grep root
ls /nonexistent_directory
echo "Script completed."
Trace this script to understand what’s happening:
strace -f -e trace=openat,write,exit_group ./problematic_script.shwrite(2, "Starting script...\n", 19Starting script...
) = 19
openat(AT_FDCWD, "/etc/passwd", O_RDONLY) = 3
write(1, "root:x:0:0:root:/root:/bin/bash\n", 32root:x:0:0:root:/root:/bin/bash
) = 32
openat(AT_FDCWD, "/nonexistent_directory", O_RDONLY|O_NONBLOCK|O_CLOEXEC|O_DIRECTORY) = -1 ENOENT (No such file or directory)
write(2, "ls: cannot access '/nonexistent_directory': No such file or directory\n", 70ls: cannot access '/nonexistent_directory': No such file or directory
) = 70
write(2, "Script completed.\n", 18Script completed.
) = 18
exit_group(0)Security Considerations
When using strace, keep these security considerations in mind:
- Privilege Requirements: You need appropriate permissions to trace processes. You can only trace processes you own unless you’re root.
- Sensitive Information: strace output may contain sensitive data like passwords, API keys, or file contents. Be careful when sharing traces.
- Performance Impact: strace can significantly slow down the traced process, so avoid using it in production unless necessary.
Troubleshooting Common Issues
Permission Denied
If you get “Operation not permitted” errors:
# Check if you can trace the process
strace -p $(pidof some_process) 2>&1 | head -1

# Use sudo if necessary
sudo strace -p $(pidof some_process)
Too Much Output
When dealing with verbose output:
# Limit to specific system calls
strace -e trace=openat,read,write command

# Count only, no detailed output
strace -c command

# Output to file and analyze later
strace -o output.txt command
Integration with Other Tools
Combining with grep
Filter strace output with grep for specific patterns:
strace -e trace=openat ls 2>&1 | grep "\.conf"Using with ltrace
While strace traces system calls, ltrace traces library calls. Use them together for comprehensive debugging:
strace -e trace=write -o strace.out program &
ltrace -e printf -o ltrace.out program
wait
Best Practices
- Start Simple: Begin with basic tracing and gradually add filters as needed
- Use Appropriate Filters: Don’t trace everything unless necessary; use -e trace to focus on relevant system calls
- Save Output: For complex debugging, save output to files for detailed analysis
- Combine Options: Use multiple options together (-f -T -c) for comprehensive analysis
- Monitor Performance: Be aware that strace adds overhead; use -c for performance-critical analysis
Conclusion
The strace command is an invaluable tool for understanding program behavior, debugging issues, and optimizing performance in Linux systems. By mastering its various options and filtering capabilities, you can effectively diagnose problems, understand system interactions, and gain deep insights into how applications work under the hood.
Whether you’re a system administrator troubleshooting server issues, a developer debugging application problems, or a security researcher analyzing program behavior, strace provides the visibility you need into the critical interface between user-space applications and the Linux kernel.
Remember to use strace responsibly, considering its performance impact and security implications. With practice and experience, strace will become an essential part of your Linux debugging toolkit, helping you solve complex problems and understand system behavior at the deepest level.
Related Posts
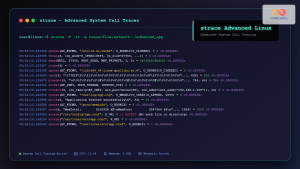
strace Advanced Linux: Complete Guide to System Call Tracing and Debugging
strace is one of the most powerful debugging and diagnostic tools available in Linux systems. It allows you to trace...
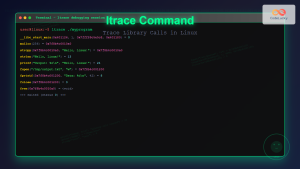
ltrace Command Linux: Complete Guide to Trace Library Calls and Debug Programs
The ltrace command is a powerful debugging and analysis tool in Linux that allows you to trace library calls made...
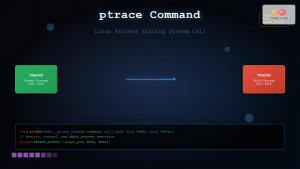
ptrace Command Linux: Complete Guide to Process Tracing System Call
The ptrace system call is one of Linux's most powerful tools for process monitoring and debugging. It allows one process...
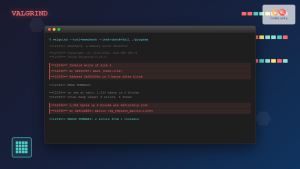
valgrind Command Linux: Complete Memory Debugging and Profiling Guide
Valgrind is one of the most powerful and essential tools for Linux developers and system administrators who need to debug...
perf Command Linux: Complete Performance Analysis and Profiling Guide
The perf command is one of the most powerful performance analysis tools available in Linux, offering comprehensive insights into system...
Process in Operating System: Complete Guide to Definition, States and Lifecycle
What is a Process in Operating System? A process is a program in execution that consists of the program code...
gdb Command Linux: Complete GNU Debugger Tutorial for Developers
The GNU Debugger (GDB) is one of the most powerful and essential tools for developers working on Linux systems. As...
gcore Command Linux: Complete Guide to Generate Core Dump Files for Debugging
The gcore command in Linux is a powerful debugging tool that generates core dump files from running processes without terminating...
ps Command in Linux: Complete Guide to Process Monitoring and Management
The ps command is one of the most fundamental and powerful tools in Linux for displaying information about running processes....

Garbage Collection in Operating System: Complete Guide to Automatic Memory Management
What is Garbage Collection in Operating Systems? Garbage collection is an automatic memory management technique used by operating systems and...
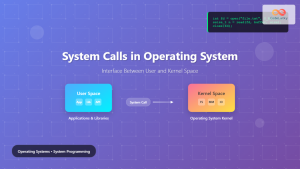
System Calls in Operating System: Complete Guide to User-Kernel Interface
System calls serve as the fundamental bridge between user applications and the operating system kernel, enabling programs to request services...
getrlimit Command Linux: Complete Guide to System Resource Limits Management
The getrlimit system call in Linux is a fundamental tool for retrieving information about resource limits imposed on processes. Understanding...


